Fig. 1.
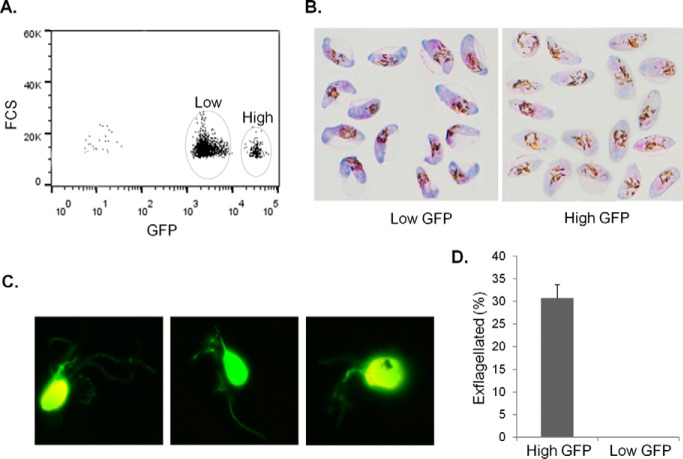
Separation of P. falciparum stage V MG and FG by flow cytometry based on differential expression of the GFP reporter under the control of α-tubulin II promoter. A, Representative plot of GFP fluorescence intensities from 3D7α−tubII/GFP stage V gametocytes shows the separation of low- and high-GFP populations (circled). Stage V gametocytes were first isolated by Percoll and then analyzed by flow cytometry. FCS: Forward scattered light. B, Sorted gametocytes from low- and high-GFP populations shown in (A) stained with Giemsa show the typical characteristics of mature FG (left) and MG (right). MG appear pink with rounded cell ends and more widely scattered pigments, whereas FG appear blue with angular cell ends and more centralized pigment. C, Pictures of exflagellating gametocytes from the high-GFP population. D, Percentage of exflagellated gametocytes from the high- and low-GFP populations. Data are shown as mean ± s.d. from three replicates.

