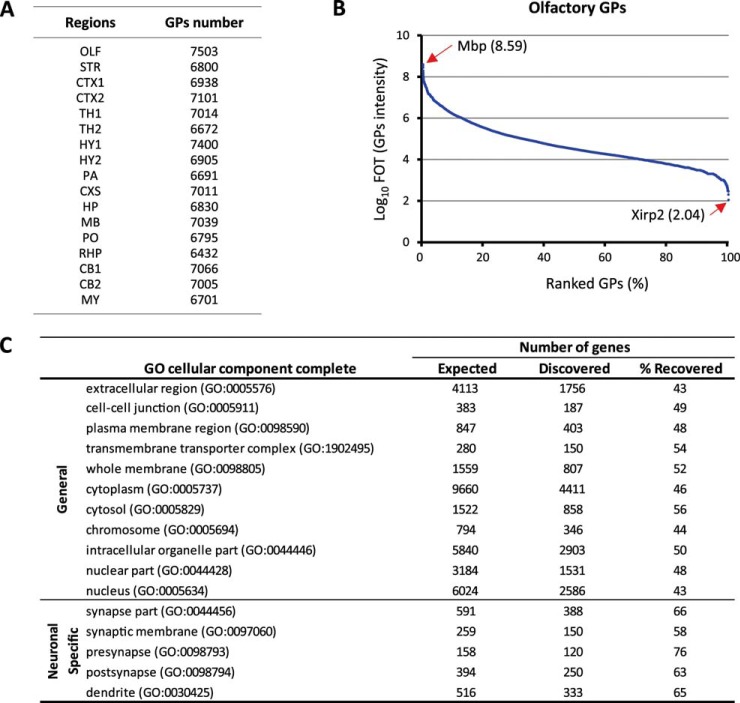
Fig. 2.
Proteome coverage. A, total GP numbers recovered from each brain region after six repeatable analyses. B, normalized protein abundances (FOT) from the highest to the lowest in olfactory sample. C, proportions of olfactory GPs annotated to various cellular compartments according to Gene Ontology.

