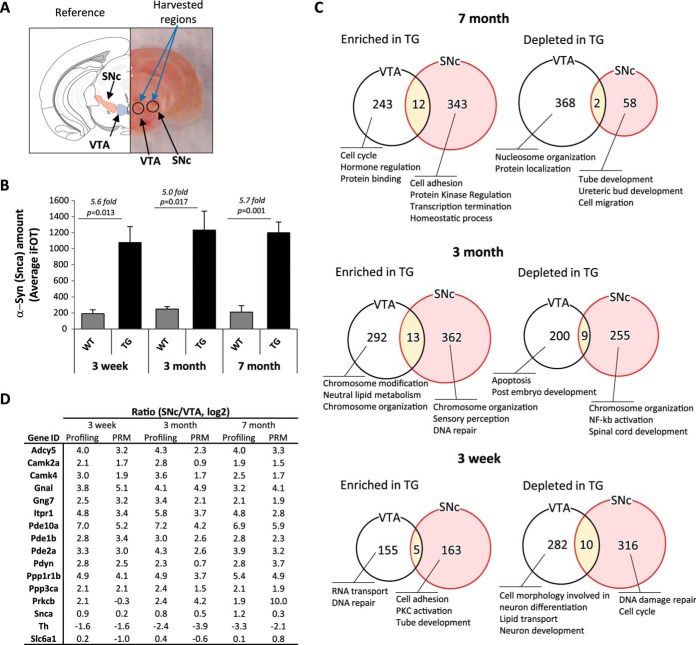
Fig. 5.
Comparative deep proteome analysis between the SNc and the VTA of α-syn transgenic mice. A, isolation of the SNc from 2-mm-thick coronal section containing midbrain (right). B, Snca iFOT distribution of SNc regions from Snca wild type and transgenic mouse. C, numbers and summarized GO term biological function of SNc-specific proteins regulated by α-syn overexpression compared with VTA. D, normal wild type SNc and VTA site-specific proteins age-dependent abundancy changes.

