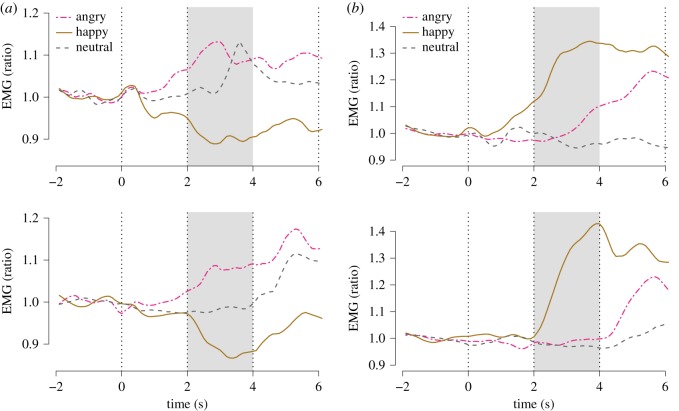
Figure 4.
Emotional mimicry: EMG time-courses. (a) Corrugator. (b) Zygomatic. Top: wave 1. Bottom: wave 2. First vertical line: onset of video clip. Second vertical line: onset of emotional expression. Third vertical line: end of video clip. Shaded box: time window for effect averaging (2–4 s). Every response was indexed to mean activity in the 2 s preceding video clip onset (−2 to −0 s).

