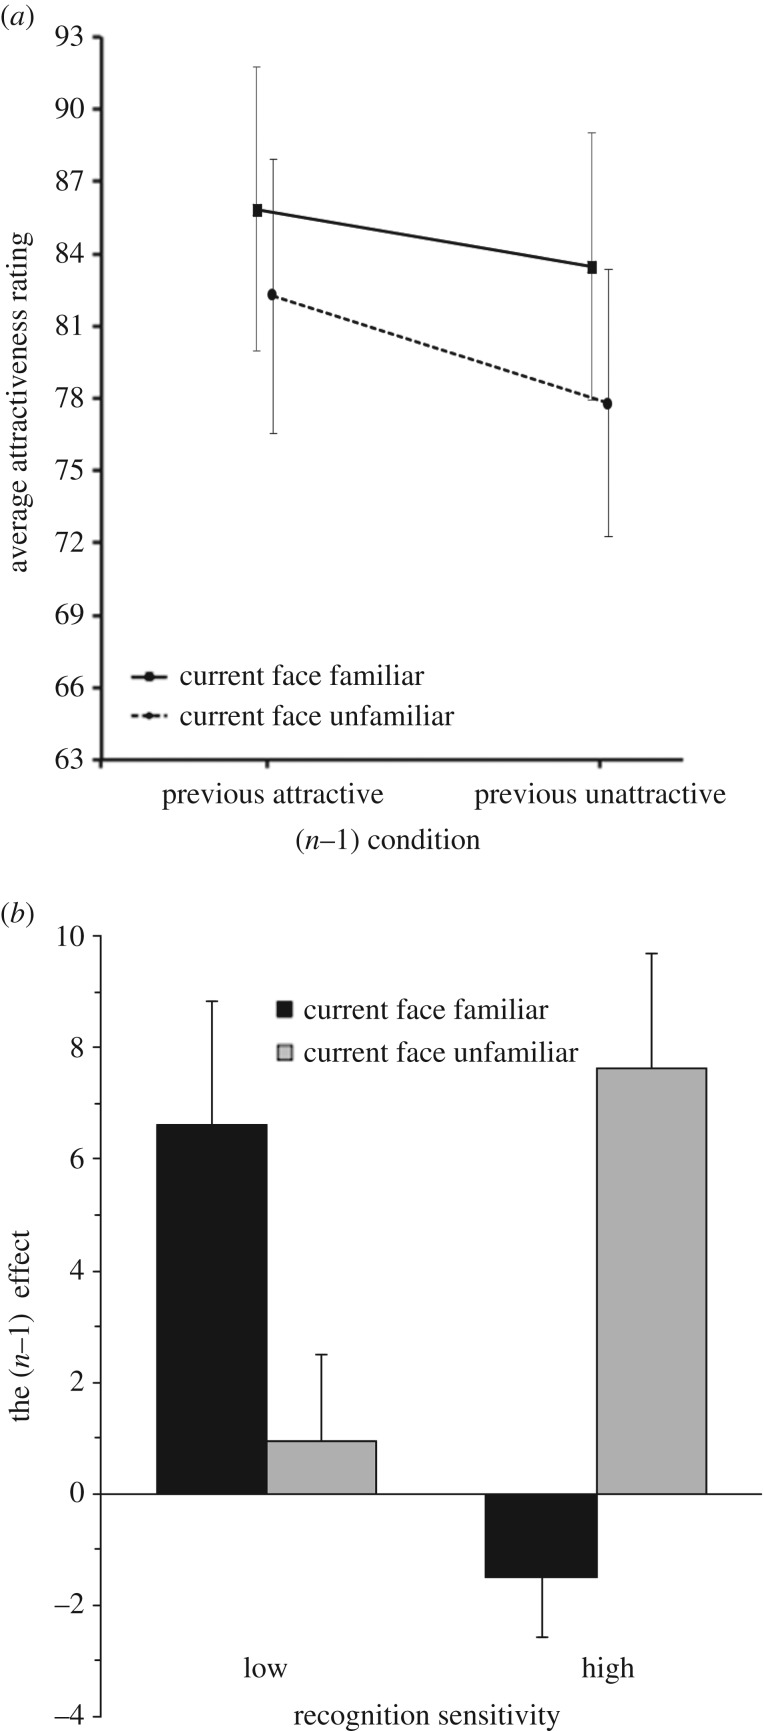
Figure 2.
Results of Experiment 1. (a) Average attractiveness ratings for familiar and unfamiliar faces as a function of attractiveness of the previous face in Experiment 1, with minimum and maximum ratings of 0 and 200, respectively. Error bars represent the standard error of the mean. (b) The mean inter-trial attractiveness effect for familiar and unfamiliar faces, for the low-sensitivity (n = 10) and high-sensitivity (n = 11) recognition groups in Experiment 1. Error bars represent the standard error of the mean.

