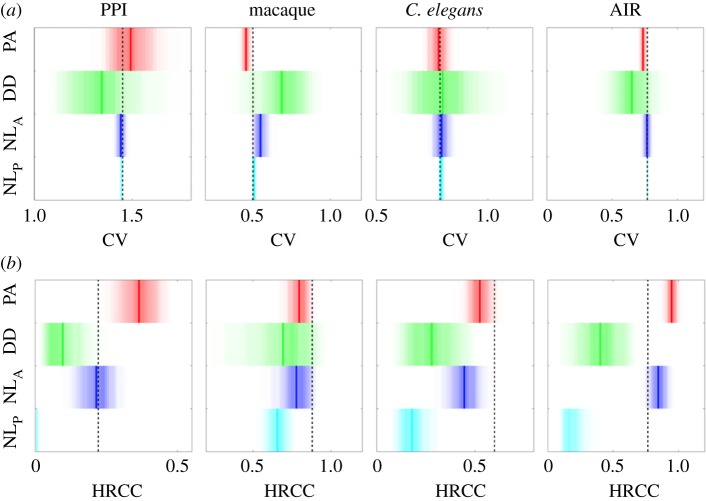
Figure 4.
Generation of network properties. Degree variation (CV, a) and mean rich-club coefficient between hubs (HRCC, b) of the models in relation to values of real-world networks (black dashed lines). Red, green, blue and cyan shaded regions indicate the distribution of values that PA, DD, NLA and NLP could yield, respectively. Thick coloured lines indicate the mean values of the distributions. The respective, model-generated connection numbers are displayed in the electronic supplementary material, figure S3.

