
Figure 5.
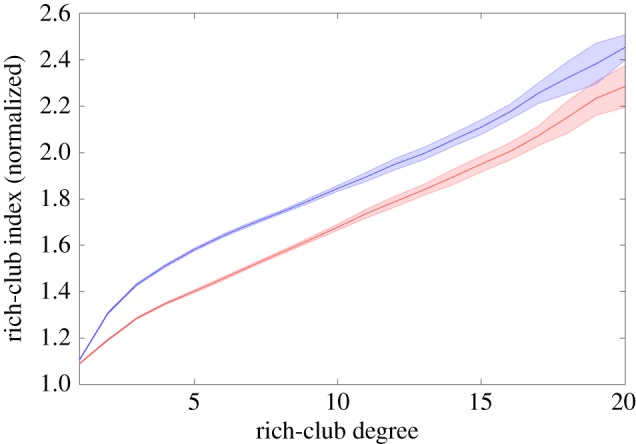
Normalized rich-club indices of control networks (red) and simulated, very preterm brain networks (blue). Shaded areas indicate standard deviation, as obtained from 20 curves per scenario. The x-axis indicates the rich club degree, i.e. the cut-off degree defining the rich-club. For the normalization of rich-club indices (y-axis), 100 reference networks preserving degree distribution were generated (hence, the number of nodes and node degree distribution do not differ in control, preterm and reference networks). These results demonstrate that the nonlinear growth model is in accordance with observations of increased rich-club organization in the structural connectome of very preterm-born adults (see also fig. 4 of [24]).