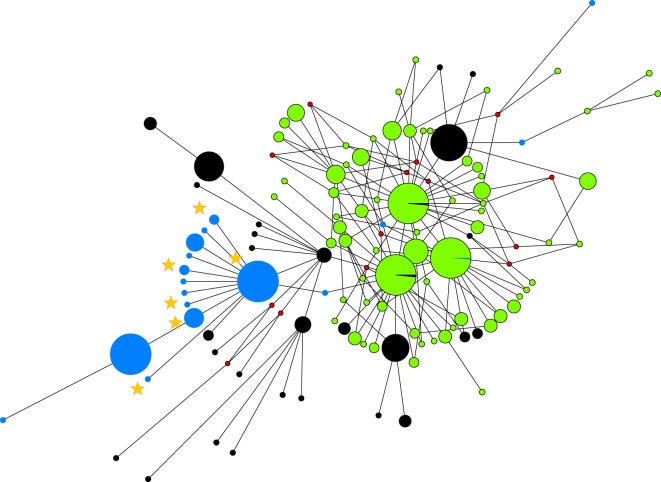
Figure 3.
Median-joining network depicting the relationship of D haplotypes of chickens from East Africa and Madagascar (blue), South Asia (black) and Indonesia (green) using all observed D haplotypes regardless of frequency. Stars mark the position of the Madagascan samples. Inferred haplotypes are indicated by small red dots.

