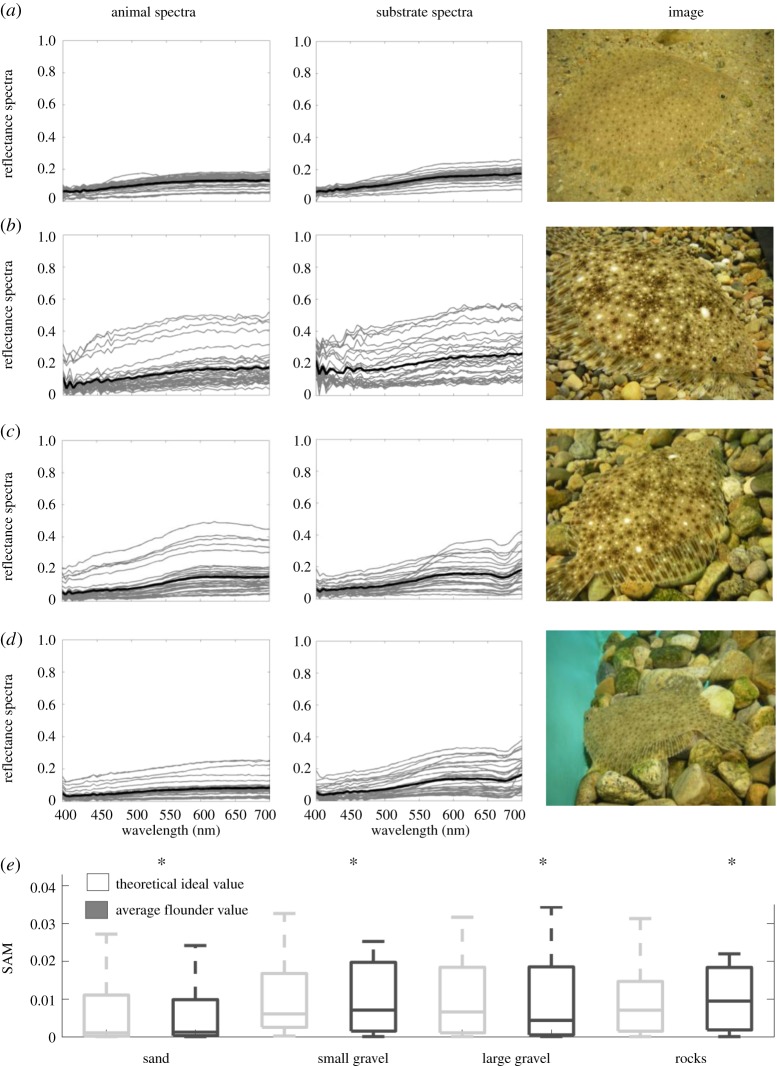
Figure 3.
All individual spectral measurements of S. aquosus (left plots) and substrates (right plots), as well as an image showing a section of flounder and substrate. Grey lines are individual spectral measurements; heavy black line is the average. (a) Flounder on sand substrate, (b) flounder on small gravel substrate, (c) flounder on large gravel substrate, (d) flounder on rock substrate. (e) We computed the SAM metric for each substrate–flounder combination for ideal and actual scenarios and compared the similarity of these distributions (see Material and methods). Overall SAM values are low, indicating similar spectral shapes between the animal and the background spectra. Asterisk indicates that, using the Wilcoxon rank sum test at the 5% significance level, data come from distributions with equal medians.

