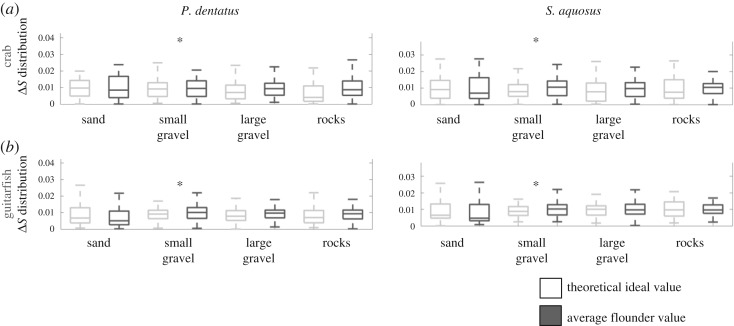
Figure 7.
Box plots showing the actual and ideal ΔS distributions calculated for two theoretical observers: dichromatic crab (a) and trichromatic ray (b). Results for each of these observers looking at P. dentatus are shown in the left panels; results for S. aquosus are shown in the right panels. The actual values for flounder, as determined by spectral measurements of flounder and substrates, are shown in dark grey; the theoretical ideal values (a calculation that considers the likelihood of detection if flounder were identical to background, i.e. a ‘perfect camouflage’ situation) are shown in light grey. Asterisks indicate that the ideal and actual distributions are statistically equivalent.

