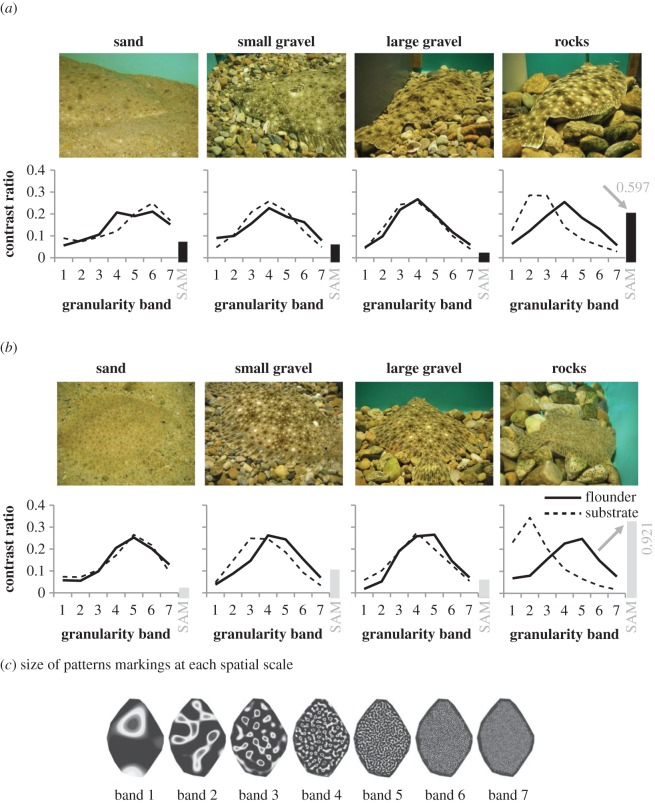
Figure 8.
(a) Images of flounder and substrates (top) and granularity plots (bottom) of P. dentatus. (b) Same as (a) for S. aquosus. On sand, small gravel or large gravel, flounder matched the spatial scale of the substrate well. A clear mismatch can be seen for flounder on rocks. The bar plot on the right-hand side of the x-axis depicts the SAM value for each granularity band; see Material and methods for details of range. (c) For granularity analysis, flounder pattern markings are binned into seven spatial frequency bands, which range in size from large (Band 1) to very small (Band 7) [22].

