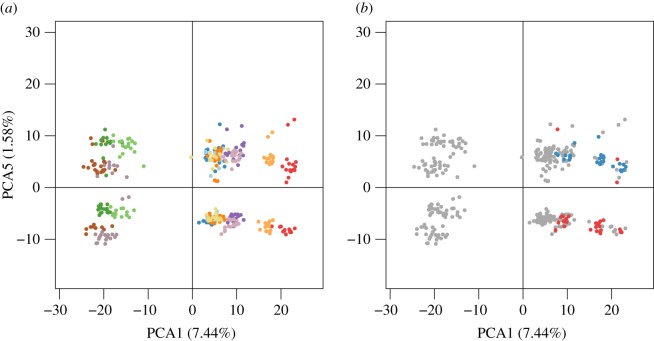
Figure 2.
Principal component analysis (axes 1 and 5) of the 12 red coral populations (n = 354 individuals, 27 461 SNPs). Colours correspond to the (a) population of individuals (light blue: BANN20, dark blue: BANN40, dark orange: BANS20, yellow: BANS40, brown: ELV12, grey: MEJ40, dark green: FIG8, light green: MOR40, red: GAL20, light orange: GAL40, dark purple: POR20, light purple: POR40; see electronic supplementary material, figure S1 and table S1) and (b) sex of individuals determined morphologically (red: females, blue: males).

