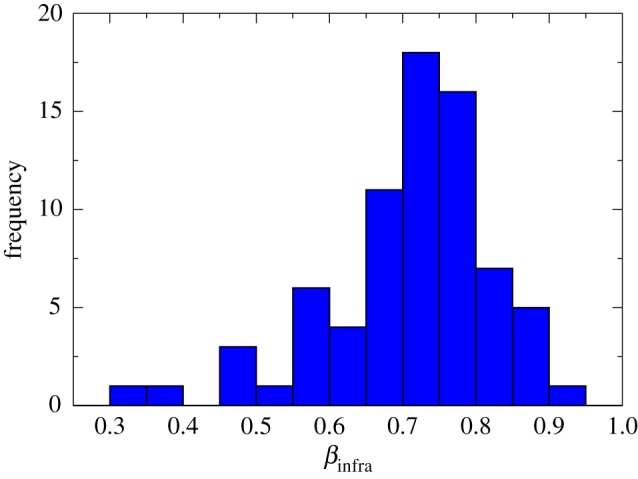
Figure 2.

Histogram showing the number of amenities with a particular value of scaling exponent (βinfra). This histogram was built with 74 amenities (for instance, bakery (βinfra=0.847), beauty salon (=0.745), gas station (=0.652) and so on), all of them presenting scaling law with the population size, across 47 US cities. It is possible to note an evident sublinear scaling for all the amenities presented. The data used were collected directly from the references [31,32].
