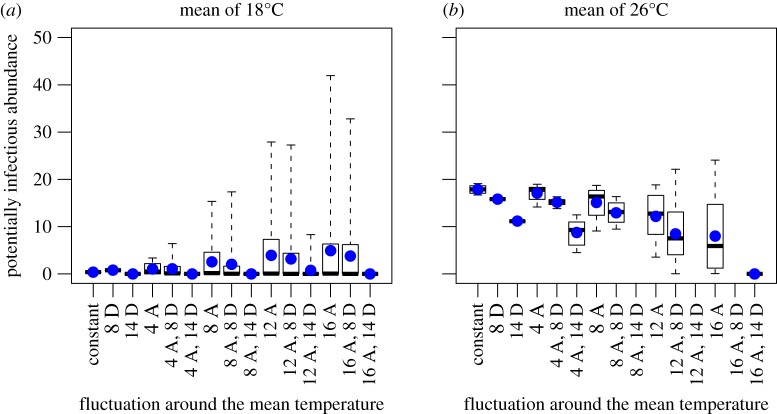
Figure 3.
Comparison of the mean, median and variation across temperature fluctuation types and sizes. Panels (a) and (b) show the abundance of the potentially infectious adult population (number of mosquitoes per litre of larval habitat) predicted by the model driven by both the constant and all the fluctuating temperature drivers. Panel (a) shows results for a mean temperature of 18°C and panel (b) shows results for a mean temperature of 26°C. The x-axis is the temperature driver, where constant denotes constant temperature, D denotes a diurnal fluctuation and A denotes an annual fluctuation. The numbers along the x-axis (4, 8, 12 and 14) indicate the size of the temperature fluctuation around the mean temperature. For example, 4A, 8D refers to a 4°C annual and an 8°C diurnal fluctuation. The x-axis is arranged in order of increasing annual fluctuation. The box and whiskers show the total variation and the median for each fluctuation and the blue dots show the mean abundance.

