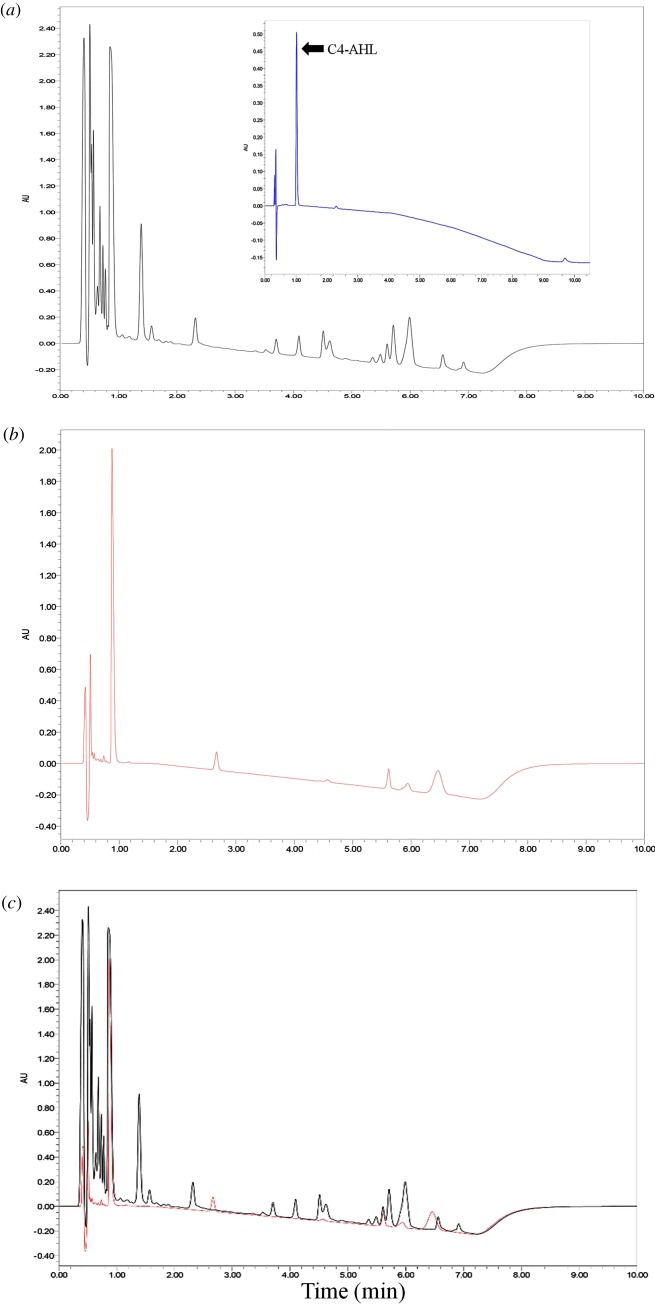
Figure 3.
Ultra-performance liquid chromatography (UPLC) analysis of extract. (a) The chromatogram shows the P. aeruginosa PAO1 extracts, the insert picture is the standard of C4-AHL (N-butyryl homoserine lactone); (b) Rhizobium sp. NAO1 extracts; and (c) the merged picture. The black line is PAO1 and the red line is NAO1. Peaks are a function of intensity measured in milli-absorption units over time in minutes.

