Figure 2.
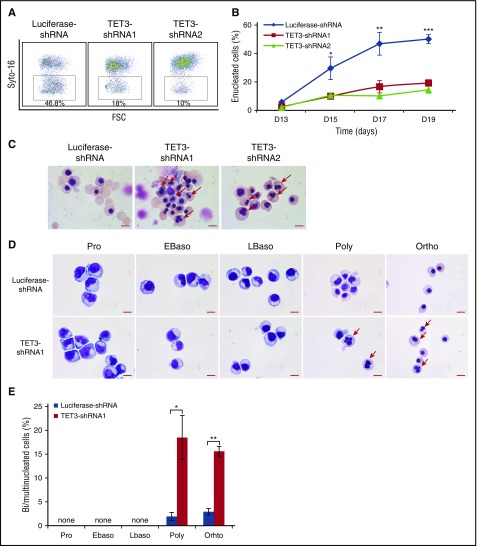
TET3 knockdown led to bi/multinucleated polychromatic/orthochromatic erythroblasts and impaired enucleation. (A) Representative profiles of enucleation as assessed by Syto-16 staining on day 17 of culture. Enucleation percentage was calculated as Syto-16–negative population in total population. (B) Quantitative analysis of enucleation on indicated days from 3 independent experiments. (C) Representative cytospin images of erythroblasts on day 17 stained with May-Grünwald Giemsa. Red arrows indicate bi/multinucleated erythroblasts. Scale bar = 10 μm. (D) Representative cytospin images of sorted erythroblasts at distinct developmental stages. The bi/multinucleated erythroblasts were observed specifically in TET3 knockdown polychromatic/orthochromatic erythroblasts. Red arrows indicate bi/multinucleated erythroblasts. Scale bar = 10 μm. (E) Quantification of bi/multinucleated erythroblasts in sorted erythroblasts at distinct developmental stages. *P < .05; **P < .01; ***P < .001. FSC, forward scatter.

