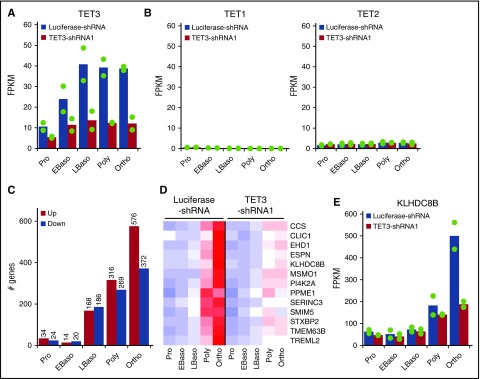
Figure 4.
Effect of TET3 knockdown on gene expression. Control and TET3 knockdown erythroblasts at each distinct developmental stage were sorted and subjected to RNA-seq analysis and bioinformatics analysis. (A) mRNA expression of TET3. (B) mRNA expression of TET1 (left) and TET2 (right). (C) Numbers of differentially expressed genes. The cutoffs for differentially expressed genes are log-fold change >1 and change in FPKM >10. (D) Heatmap of 13 genes, which are highly upregulated at very late stage of normal erythropoiesis and downregulated by TET3 knockdown. The red, white, and blue colors represent the expression level from high to low. (E) mRNA expression of KLHDC8B. FPKM, fragments per kilobase per million fragments mapped.

