Figure 6.
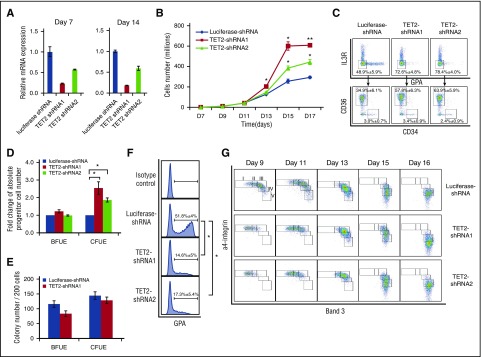
TET2 knockdown led to accumulation and delayed differentiation of erythroid progenitors. (A) Expression of TET2 as assessed by RT-PCR, with β-actin as internal calibrator. (B) Growth curves of luciferase-shRNA and TET2-shRNA–transduced cells. (C) Flow cytometric analysis of erythroid progenitor populations of cells cultured for 6 days. (D) Fold change of absolute progenitor cell numbers in total culture. Error bars indicate SEM (n = 3). (E) Colony forming ability of sorted progenitor cells. (F) Expression of GPA on day 7 of culture. *P < .05; **P < .01. (G) Representative expression profiles of α4 integrin and band 3. The erythroblasts are separated into 5 populations: proerythroblasts (I), early basophilic erythroblasts (II), late basophilic erythroblasts (III), polychromatic erythroblasts (IV), and orthochromatic erythroblasts (V).

