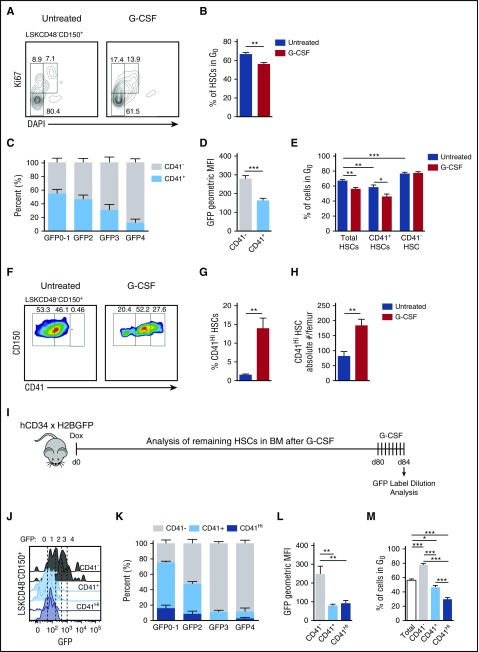
Figure 4.
Proliferation in response to G-CSF is limited to CD41 expressing cells within the HSC compartment. (A) Representative plots displaying cell cycle status of the HSC compartment in response to G-CSF. (B) Quantification of G0 HSCs in panel A. (C) Distribution of CD41 expression on HSCs across GFP gates after a 12-week chase during homeostasis (no G-CSF). (D) Quantification of CD41− and CD41+ HSC GFP fluorescence intensities during homeostasis. (E) Quantification of total, CD41+, and CD41− HSCs in G0 with and without G-CSF treatment. (F) Representative plots of CD41 expression on HSCs with and without G-CSF treatment. (G) Quantification of CD41Hi cells within the HSC compartment. (H) Absolute numbers of CD41Hi HSCs in the BM. (I) Label dilution experimental set-up. (J) GFP histograms of CD41−, CD41+, and CD41Hi HSCs after G-CSF treatment. (K) Representation of CD41−, CD41+, and CD41Hi HSCs within each GFP gate after G-CSF treatment. (L) GFP fluorescence intensities after G-CSF treatment. (M) Cell cycle analysis of CD41−, CD41+, and CD41Hi HSCs after G-CSF treatment. Data are represented as mean ± SEM. n = 14 and 9 mice for control and G-CSF treatments, respectively (B, E, G, and H); n = 10 mice (C and D); n = 7 mice (K and L); n = 9 mice (M). *P < .05, **P < .01, ***P < .001 by Welch’s t test (B,E,G-H), paired t test (D), or 1-way repeated measures ANOVA with Tukey’s multiple comparison test (L-M).

