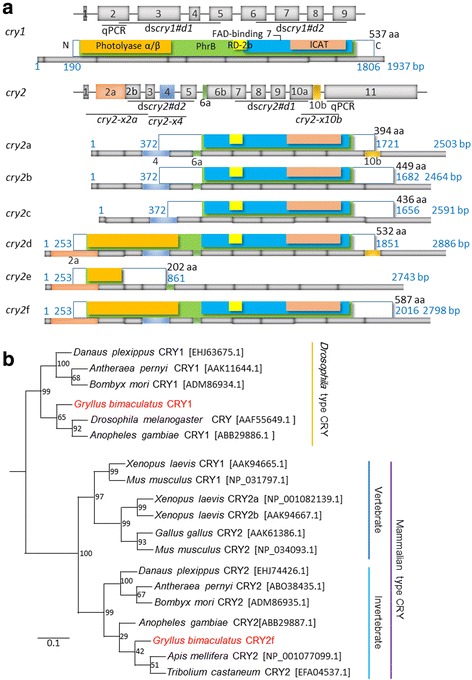
Fig. 1.

Sequence alignments and a phylogenetic tree of Gb’cry1 and Gb’cry2. a Schematic structure of Gb’cry1 and Gb’cry2 cDNAs and their deduced product proteins, showing conserved domains, photolyase α/β (orange), PhrB (green), RD-2b (yellow), FAD-binding 7 (blue), and inhibition of CLOCK-ARNTL-mediated transcription (ICAT) domain (pink). At the top of schemes of each gene exon/intron structure is illustrated. There are six splicing variants for Gb’CRY2, of various lengths. The bars under each protein scheme show cDNA structure and the colored portions indicate the respective exons. Numbers shown at the right of protein illustration indicate the number of amino acid residues (aa) and the blue numbers indicate the number of base pairs. The regions used for qPCR and dsRNA synthesis are also shown. cry2-x2a, -x4, and –x10b are for PCR for amplification of variants with or without exon 2a, 4, and 10b, respectively. b A phylogenetic tree of known insect and vertebrate CRY proteins. CRY amino acid sequences were analyzed, and the phylogenetic tree was inferred by the maximum likelihood method in MEGA 7.0. The GenBank or RefSeq accession numbers are indicated in brackets. The reference bar indicates the distance as number of amino acid substitutions per site
