Fig. 2.

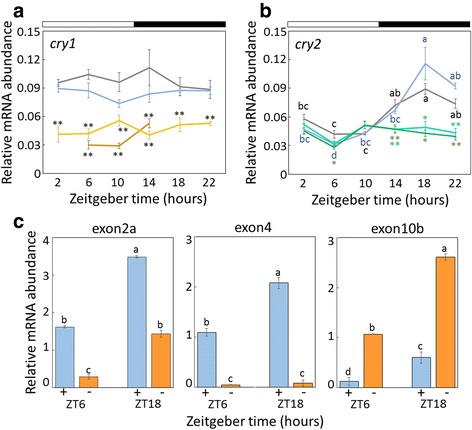
Expression profiles of Gb’cry1 (a) and Gb’cry2 mRNA (b, c) in Gryllus bimaculatus optic lobes under LD 12:12. In (a) and (b), abundance of Gb’cry1 and Gb’cry2 mRNA is shown for intact (blue), dsDsRed2 (gray), dsGb’cry1#d1 (yellow), dsGb’cry1#d2 (dark yellow), dsGb’cry2#d1 (dark green), dsGb’cry2#d2 (green) treated crickets. Total RNA was extracted from the optic lobes that were collected at 4-hour intervals starting at 2 h after lights-on (ZT 2). White and black bars indicate light and dark, respectively. Gb’cry1 was rather constitutively expressed. Gb’cry2 showed rhythmic expression in intact and DsRed2 RNAi crickets (cosinor, P < 0.01), while the rhythm disappeared when treated with dsGb’cry2 (cosinor, P > 0.05). Note that dsRNA significantly reduced mRNA levels of respective genes, while DsRed2 dsRNA had no significant effect. Asterisks indicate significant difference between control (DsRed2 RNAi) and treated crickets (*P < 0.05, **P < 0.01, Dunnett’s test). c Semi-quantification of Gb’cry2 mRNA levels at ZT6 and ZT18 with (blue) and without (orange) exon 2a, 4, or 10b. Different lower case letters indicate that values are significantly different with each other (ANOVA followed by Tukey-test, P < 0.05). For (a–c), data collected from three or five independent experiments were averaged and plotted as mean ± SEM. The abundance of Gb’rpl18a mRNA was used as an internal reference
