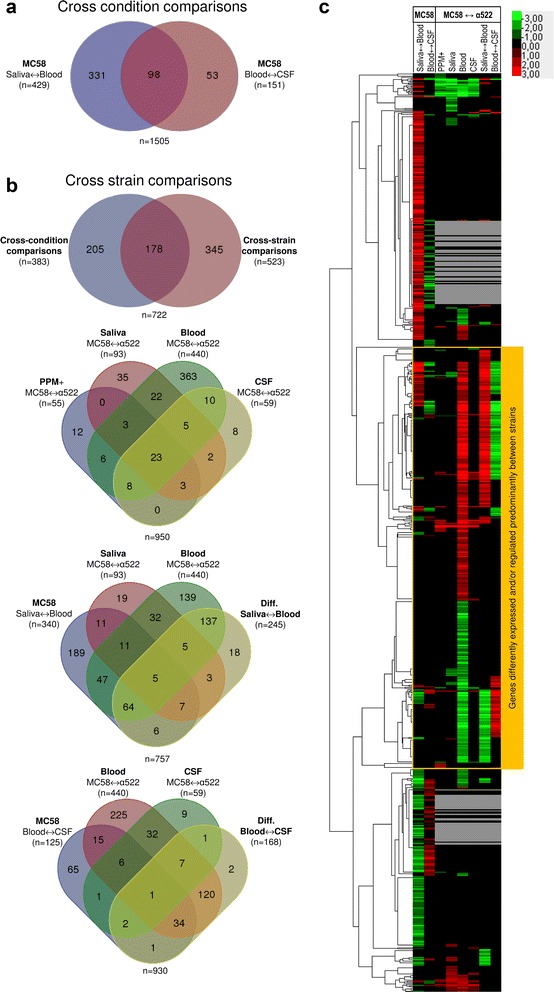
Fig. 1.

Genes significantly differently expressed and/or regulated in cross-condition and/or cross-strain comparisons. a Venn diagram comparing sets of genes in strain MC58 differently expressed between conditions as indicated. The total number of genes compared was 1987. b Venn diagrams comparing sets of genes differently expressed between strains as indicated with each diagram. The total number of genes compared in each panel was 1450. c Heatmap depicting cross-condition and cross-strain gene expression differences and hierarchical clustering of significantly differently expressed genes. Average linkage clustering based on the Spearman rank correlation of all 828 genes significantly differently expressed and/or regulated in at least one cross-condition and/or cross-strain comparison (FDR < 0.05). Grey lines correspond to genes that were absent in the α522 genome sequence and therefore excluded from the cross-strain comparisons
