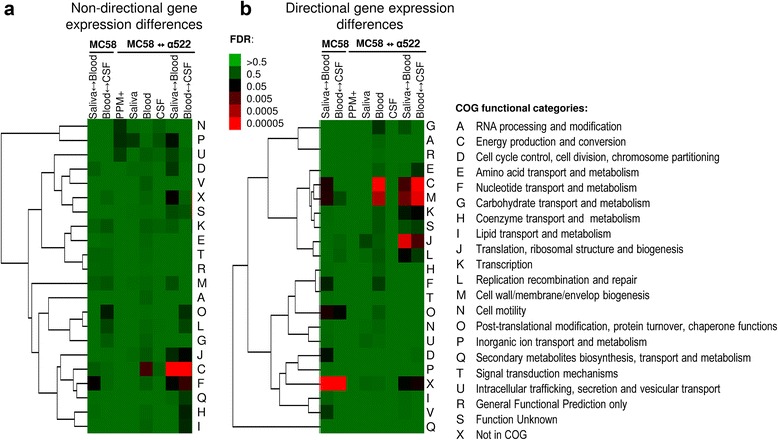
Fig. 2.

Gene set enrichment analysis of differently expressed genes. a Non-directional comparison of significantly differently expressed gene sets according to the COG functional classification scheme for cross-condition and cross-strain comparisons, respectively, indicating significantly overrepresented functional categories among the significantly differently expressed genes. b Directional comparison of significantly differently expressed gene sets according to the COG functional classification scheme for cross-condition and cross-strain comparisons, indicating significant gene expression asymmetries. In both panels, the heat map depicts significantly enriched COG functional categories in red coloring. The kind of comparison (cross-condition for strain MC58 and cross-strain for each condition) is indicated for each column of the heat maps, and the corresponding FDRs are color coded and given in the respective inserts. The associated tree is based on average linkage clustering of the functional categories using the Spearman rank correlation coefficient
