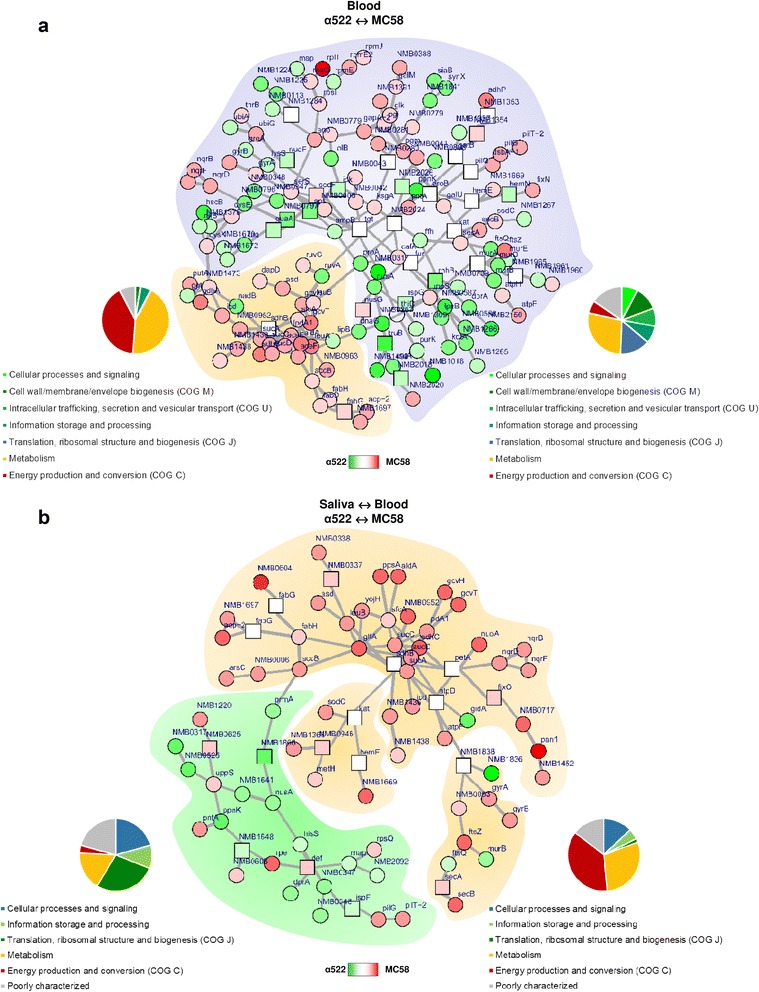
Fig. 3.

Analysis of gene expression data based on protein-protein interaction networks. a Integrative network analysis of differently expressed genes between strain MC58 and α522 in human whole blood based on the STRING protein-protein interaction network for strain MC58 (FDR < 10−9). A subnetwork that consists predominantly (30/35) of genes that were expressed at higher levels in MC58 than in α522 and that code for metabolic genes and in particular for genes involved in energy production and conversion (85%) is shaded in orange. The remaining part of the network comprising 128 protein-coding genes is shaded in light blue. b Integrative network analysis of gene regulation differences between both strains upon transition from saliva to blood (FDR < 10−7). The two modules consisting predominantly of genes either upregulated in α522 (15/25) or MC58 (47/59) upon transition from saliva to blood are shaded in green and orange, respectively. Only 21% of the genes in the left subnetwork consisting mainly of genes that were upregulated in α522 code for proteins involved in (energy) metabolism compared to over 66% of the genes that were upregulated in MC58 upon transition from saliva to blood. For each gene, the respective expression differences between conditions and strains, respectively, are color coded and indicated in each panel. White boxes indicate genes that were not differently expressed but are part of a subnetwork as identified by the integrative network analysis. Pie charts next to the sub-networks in each panel show the distribution of proteins in the respective subnetwork over the different COG functional classes
