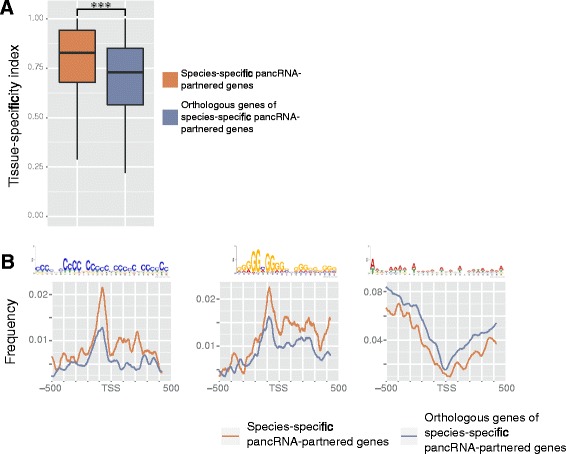
Fig. 5.

Expression pattern and genomic features of species-specific pancRNA-partnered genes. a. Tissue-specificity index of species-specific pancRNA-partnered genes and their orthologous genes in the four other species. *** P <0.001; The error bars indicate the first and third quartiles. b. Observed frequency of each DNA motif shown in Fig. 3a at the regions around TSSs (−500 bp to +500 bp relative to the TSSs) of each group of genes (any species-specific pancRNA-partnered genes and their orthologous genes in the other four species)
