
Fig. 5.
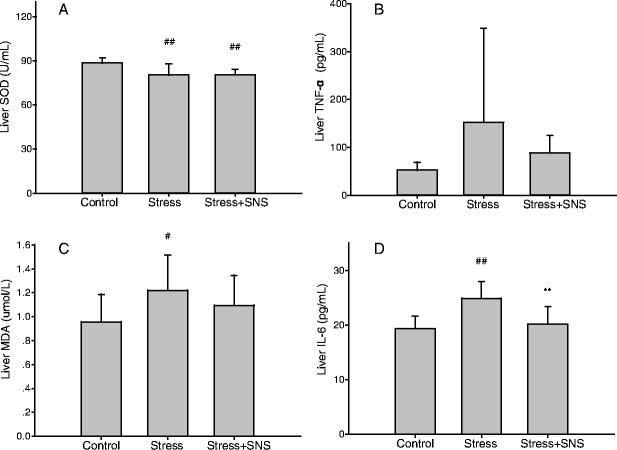
The oxidative stress and inflammation of the liver. a The superoxide dismutase (SOD) level of each group. b The tumor necrosis factor (TNF)-α level of each group. c The malondialdehyde (MDA) level of each group. d The liver interleukin (IL)-6 level of each group. Values plotted are a mean ± standard deviation (N = 10 per group). #p < 0.05, ##p < 0.01 versus the control group, **p < 0.01 versus the stress group. SNS, Sinisan