
Fig. 6.
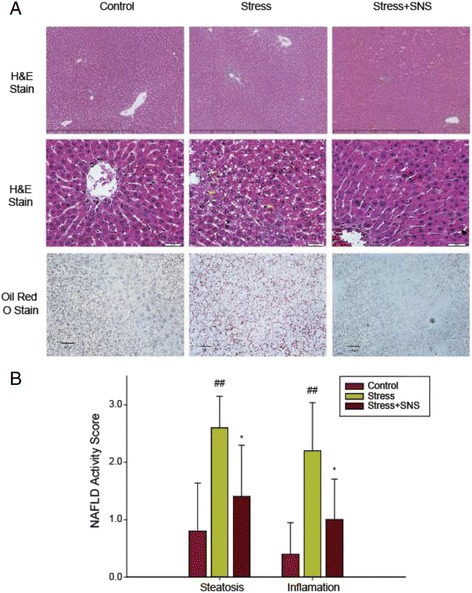
Photomicrographs of histological changes in the rat liver. a Representative slides show hematoxylin and eosin (HE)-stained and oil red O-stained liver sections from rats of each group. HE sections show chronic stress causing foci of inflammatory cell infiltration and lipid deposits (yellow arrows) (original magnification, ×100 and ×400, respectively). b The nonalcoholic fatty liver disease (NAFLD) activity score was evaluated using the New York NAFLD score system. Values plotted are a mean ± standard deviation (N = 10 per group). ##p < 0.01 versus the control group, *p < 0.05 versus the stress group