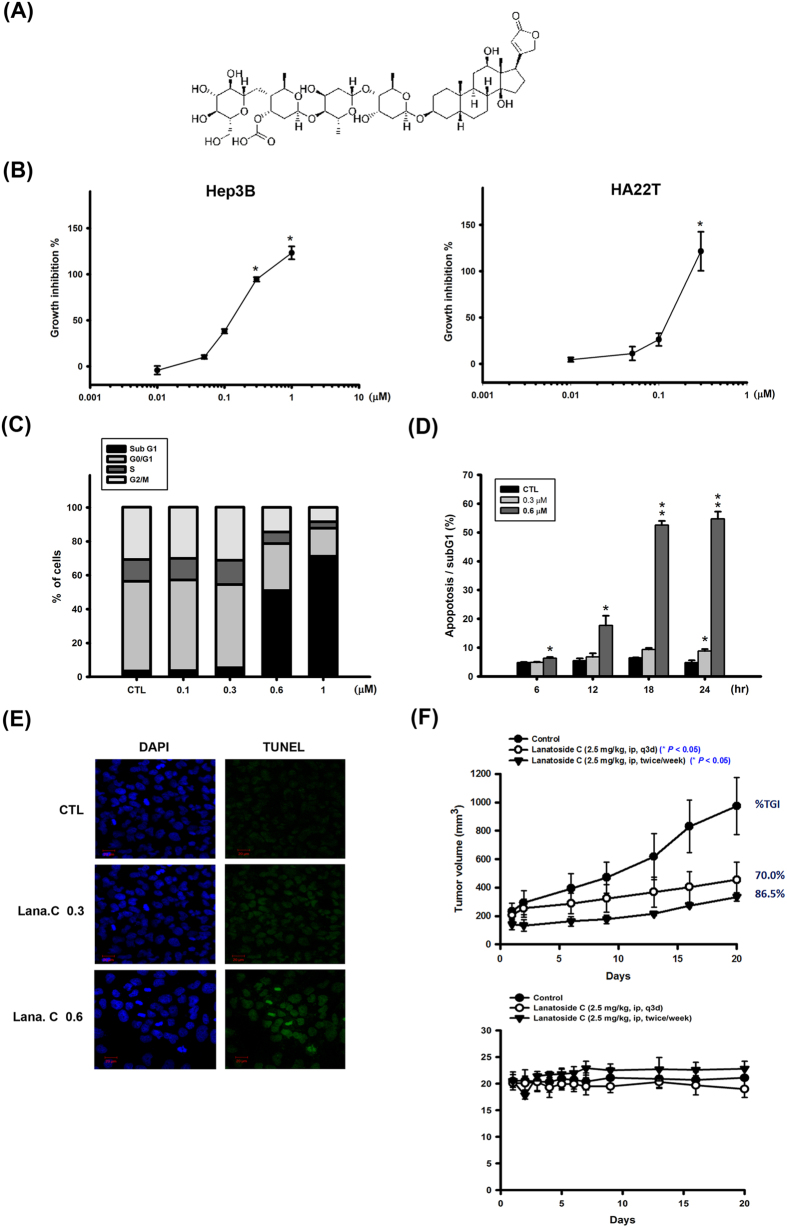
Figure 1. Effect of lanatoside C on cell proliferation, cell cycle of HCC cell lines, and Hep3B xenograft model.
(A) Structure of lanatoside C. (B) Hep3B and HA22T cells were exposed to lanatoside C for 48 h, and then detected % of control cell growth by SRB assay. Lanatoside C induced Hep3B cell apoptosis in a concentration-dependent (C) and time-dependent (D) manner by FACScan flow cytometry analysis with propidium iodide (PI) staining. (E) Hep3B cells were incubated with lanatoside C in indicated concentration for 18 hr. Cells were stained with TUNEL assay (green fluorescence) and DAPI (blue fluorescence) in the same area. Magnification of TUNEL staining was 200X. (F) SCID mice were ectopically implanted with Hep3B cells. The upper curves show the effect of lanatoside C (2.5 mg/kg, ip, q3d or 2.5 mg/kg, ip, twice a week) on tumor volume and percentage of tumor growth delay (TGD), which was calculated for treatment groups relative to control group; the lower curves show the body weight of mice after indicated treatment. Data are expressed as means ± SEM of three independent determinations. *P < 0.05 and **P < 0.01, untreated cell versus lanatoside C-treated groups.

