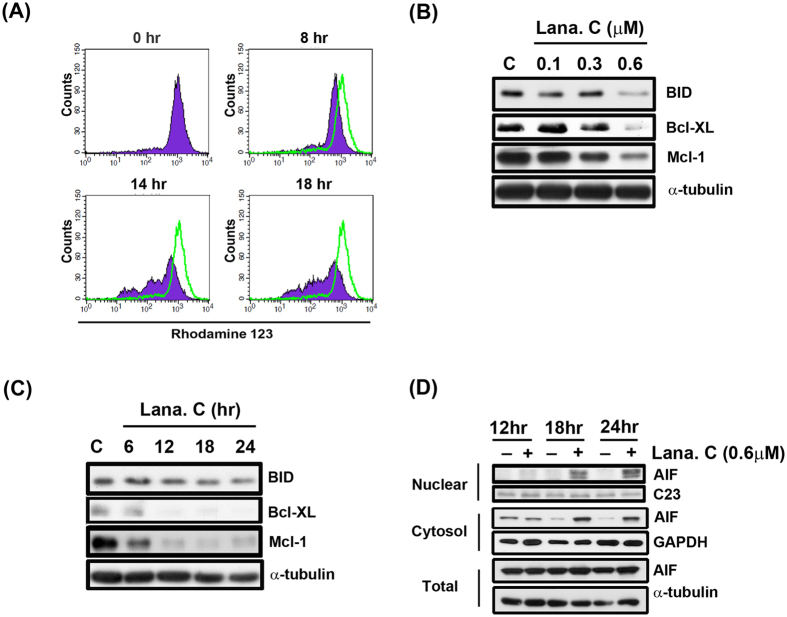
Figure 2. Effect of lanatoside C on MMP and mitochondrial related proteins.
(A) Hep3B cells were incubated with DMSO (0 h) or with lanatoside C (0.6 μM) at indicated times and then cells were incubated with rhodamine123 (5 μM) for 30 minutes. Data acquisition and analysis were performed on a FACScan flow cytometry. (B) Hep3B cells were treated with a range of lanatoside C concentration (0.1–0.6 μM) for 18 hr. (C) Hep3B cells were treated with lanatoside C (0.6 μM) for indicated time (6–24 h), and then cells were harvested from total lysates for detection of BID, Bcl-xL and Mcl-1 protein expressions by using Western blot analysis. α-tubulin was used as internal control. (D) Hep3B cells were treated lanatoside C (0.6 μM) for 12 h, 18 h, and 24 h and detected of AIF in nuclear, cytosol fraction and total lysate by Western blot analysis. C23, GAPDH and α-tubulin was a nuclear, cytosol and total lysate marker protein, respectively, used as internal controls. Data are representative of three independent experiments.

