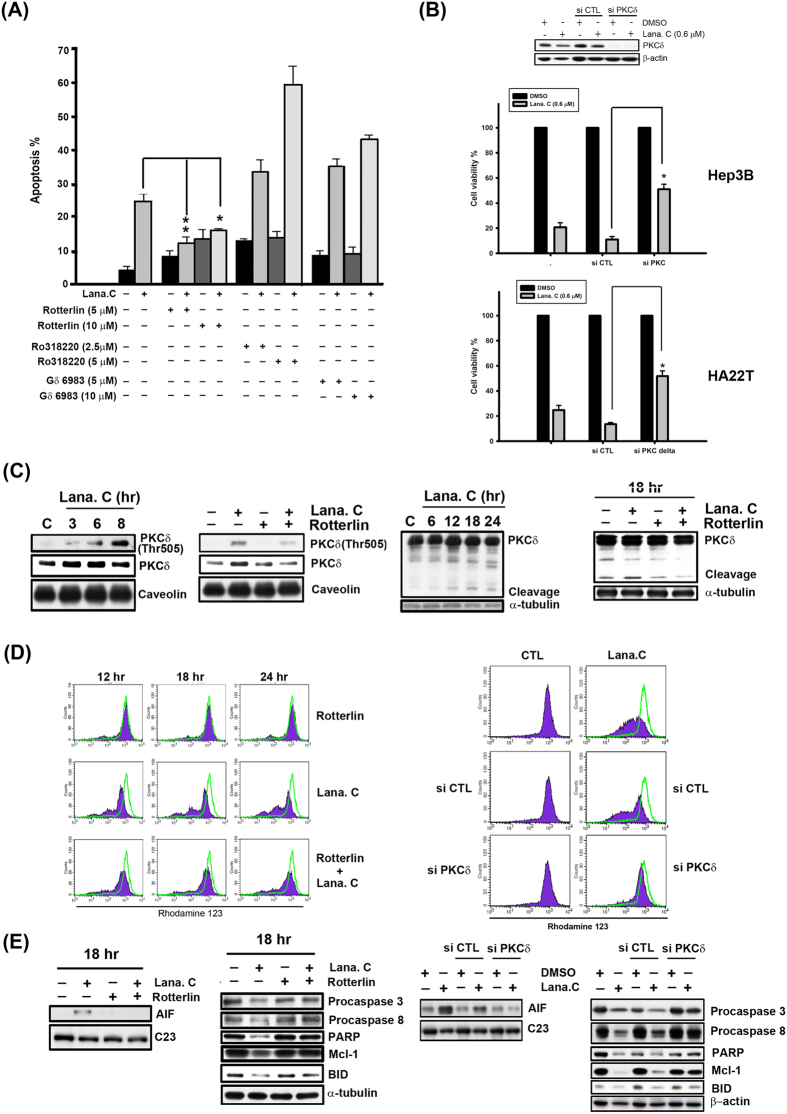
Figure 4. Activation of PKCδ was involved in lanatoside C-induced apoptosis.
(A) Hep3B cells were incubated with different PKC inhibitors (Ro318220: pan-PKC inhibitor, Gö 6983: classical PKC inhibitor, and Rottlerin: PKCδ inhibitor) for 18 h and subsequently analyzed by FACScan flow cytometry with PI staining to determine their sub-G1 proportion. Data are expressed as means ± SEM of three independent determinations. *P < 0.01 and **P < 0.05, untreated cell versus lanatoside C-treated cells. (B) Hep3B and HA22T cells were transfected with PKCδ or control siRNA, followed by treatment with lanatoside C (0.6 μM) for 18 h. Cell viability was determined by MTT assay. (C) Hep3B cells were treated with lanatoside C (0.6 μM) or co-incubated with rottlerin (5 μM) for the indicated time and detected of PKCδ Thr505 in membrane fraction and PKCδ from total lysates by Western blot analysis. Caveolin was a membrane marker protein and α-tubulin used as internal control. (D) Hep3B cells were treated with lanatoside C (0.6 μM), rottlerin (left panel) or PKCδ siRNA (right panel), or combination treatment for 18 h and then incubated with rhodamine123 (5 μM) for 30 min. Data acquisition and analysis were performed on a FACScan flow cytometry. (E) Hep3B Cells were incubated with Lanatoside C (0.6 μM), rottlerin (5 μM) or PKCδ siRNA, or combination treatment for 18 h. Cells were harvested from nuclear fraction and total lysates for detection of the indicated protein expressions by using Western blot analysis. C23 was a nuclear marker protein used as internal control. Results are representative of three independent experiments.

