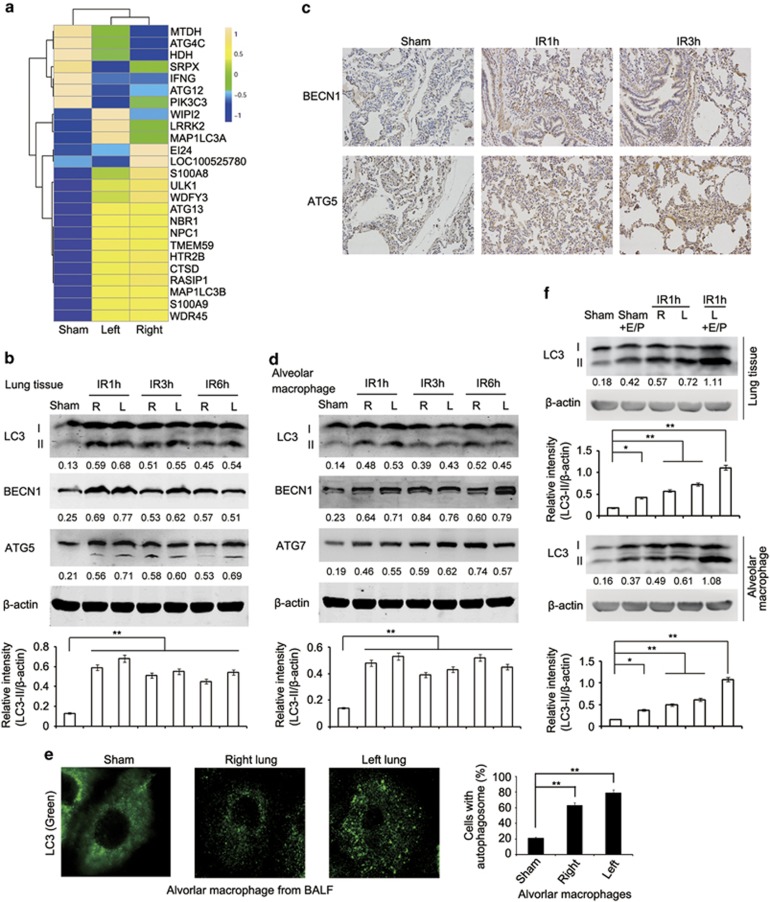
Figure 2.
Lung I/R injury induces autophagy in lung tissues of minipigs. (a) Heat maps showing hierarchical clustering of differentially expressed transcripts of autophagy related genes in right or left lung tissues from the sham group or minipigs subjected to lung ischemia followed by reperfusion for 1 h. (b) Immunoblotting analysis of LC3, BECN1, ATG5 and β-actin (as a loading control) in lysates of right or left lung tissue from the sham group or minipigs subjected to lung I/R as indicated. (c) Immunohistochemical staining of BECN1 and ATG5 in left lung tissue of the sham group or minipigs subjected to lung I/R as indicated. (d) Immunoblotting analysis of LC3, BECN1, ATG7 and β-actin (as a loading control) in lysates of alveolar macrophages from BALF of the sham group or minipigs subjected to lung I/R as indicated. (e) Immunofluorescence analysis of LC3 in alveolar macrophages from BALF of the sham group or minipigs subjected to lung ischemia followed by reperfusion for 1 h. Original magnification, × 630. Quantification of cells with autophagosomes was also shown. (f) Immunoblotting analysis of LC3 and β-actin (as a loading control) in lysates of lung tissues (upper) or alveolar macrophages (lower) from the sham group or minipigs subjected to 1 h left lung ischemia and perfusion with pulmonary protective solution containing E64d (15 μg/ml) and Pepstatin A (15 μg/ml) or DMSO followed by reperfusion for 1 h. The band densitometry was quantified using ImageJ software (National Institutes of Health, Bethesda, MD, USA). Values below lanes represent the relative intensities of the corresponding proteins (LC3-II, BECN1, ATG5 and ATG7) to β-actin in the same lane. The relative band intensities of LC3-II/β-actin were calculated from three independent experiments and shown as mean±S.E.M. Data are representative of three individual experiments (b–f). *P<0.05, **P<0.01

