Figure 1.
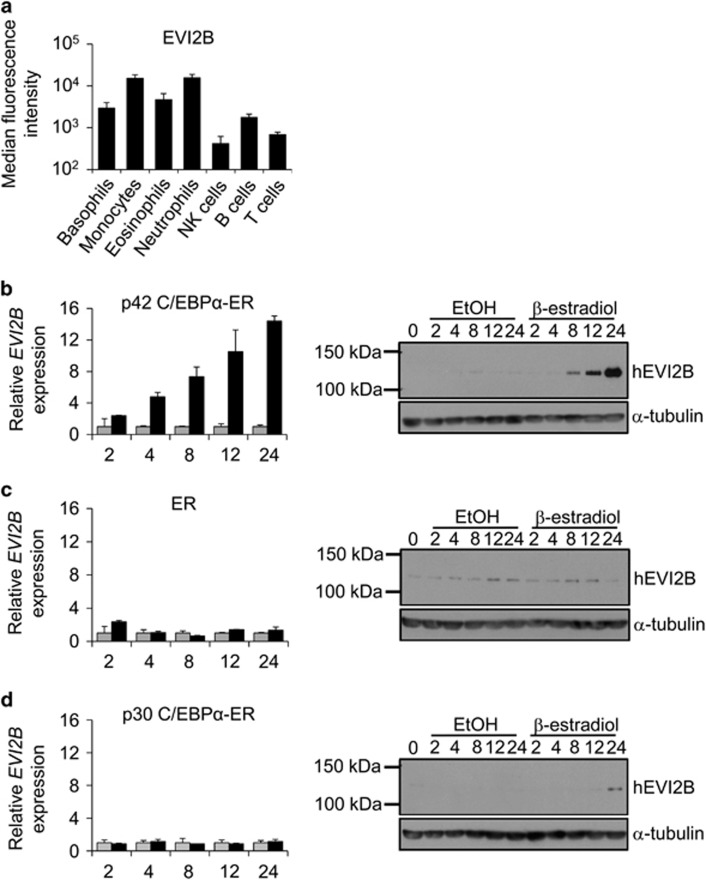
EVI2B is expressed in myeloid cells and upregulated upon p42 C/EBPα-ER activation. (a) Flow cytometric analysis of EVI2B expression in different populations of human buffy coat samples. The y axis is shown in logarithmic scale and represents median fluorescence intensity of EVI2B signal. The x axis shows different hematopoietic populations. Results represent average measurement of four buffy coats. (b–d) Quantitative RT-PCR and western blot analysis of K562 cells overexpressing (b) p42 C/EBPα-ER, (c) ER or (d) p30 C/EBPα-ER treated with 1 μM β-estradiol (black bars) or EtOH vehicle control (gray bars). The y axes represent relative human EVI2B mRNA expression compared to vehicle control treatment. The x axis indicates hours upon stimulation. RT-PCR results represent the average of two independent experiments, each done in duplicate. Western blots: upper panels show murine EVI2B staining and lower panels α-tubulin loading control. Positions of m.w. standards (kDa) are shown on the left

