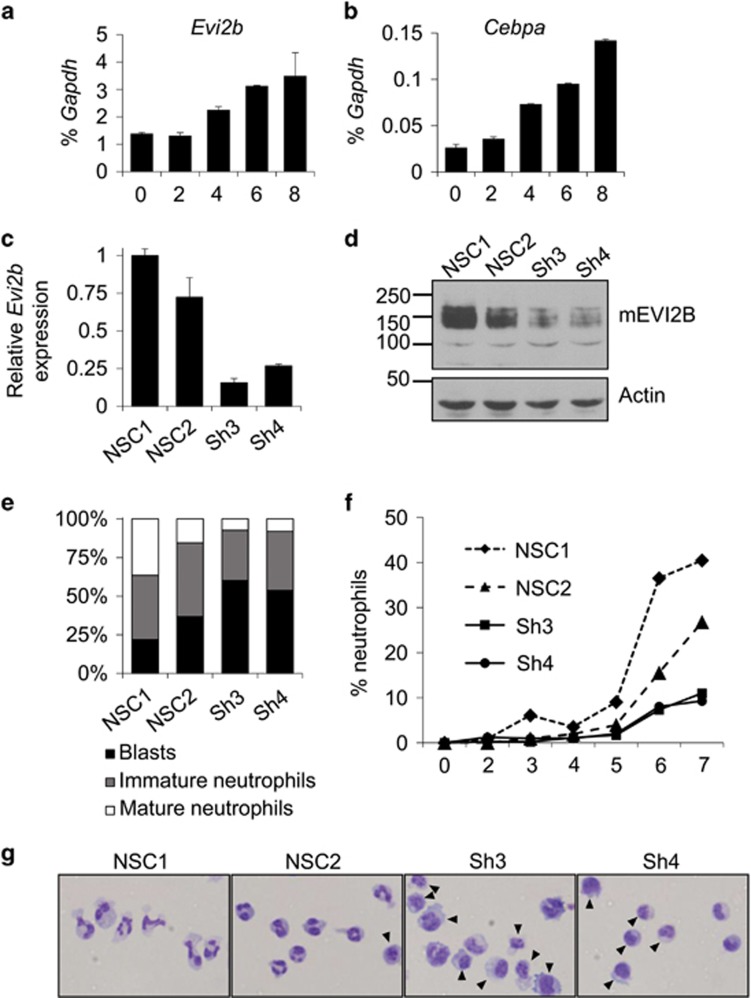
Figure 4.
Evi2b knockdown blocks granulocytic differentiation in mouse 32D/G-CSF-R cells. (a and b) Quantitative RT-PCR in 32D/G-CSF-R cells treated with G-CSF (100 ng/ml) for 8 days. The y axes represent relative expression of (a) Evi2b and (b) Cebpa compared to Gapdh. The x axes indicate days of treatment. Results represent the average of two independent experiments. (c) Quantitative RT-PCR in 32D/G-CSF-R cells transduced with distinct shRNA lentiviral constructs 5 days after infection. The y axis indicates fold change of Evi2b mRNA level after transduction with Evi2b silencing shRNA (Sh3, Sh4) compared to non-silencing controls (NSC1, NSC2). (d) Western blot analysis in 32D/G-CSF-R cells after transduction with the distinct shRNA lentiviral constructs. Upper panel shows murine EVI2B staining and lower panel Actin loading control. Positions of m.w. standards (kDa) are shown on the left. (e) Differential counting of mature neutrophils (white bars), immature neutrophils (gray bars), and blasts cells (black bars) in control and Evi2b-silenced 32D/G-CSF-R cells treated with G-CSF (100 ng/ml) for 7 days in May-Grünwald Giemsa stained cytospins. (f) Percentage of mature neutrophils during the course of G-CSF-induced neutrophilic differentiation of 32D/G-CSF-R cells. Samples were cytospun every day during 7 days of treatment. The x axis demonstrates the time of treatment (days), the y axis represents the percentage of neutrophils. (g) Representative pictures of 32D/G-CSF-R cells treated with G-CSF for 7 days, cytospun and stained with May-Grünwald Giemsa. Black arrows indicate blasts. Original magnification, x40 (e–g) Experiments were performed three independent times and at least 100 cells were counted for each sample

