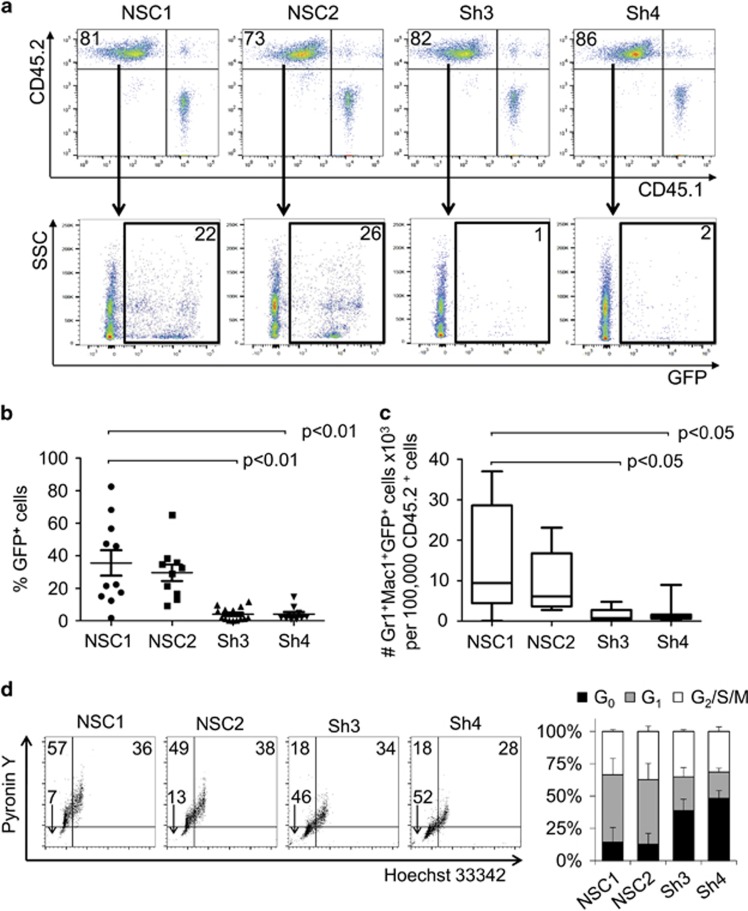
Figure 6.
Evi2b knockdown impairs repopulating ability of HSPC. (a) Representative dot plot showing engraftment of donor CD45.2+ cells transduced with control (NSC1 and NSC2) or Evi2b-silenced (Sh3 and Sh4) constructs and support CD45.1 spleen cells (upper panels). GFP+ cells within the CD45.2+ gate are shown in the lower panels. Numbers indicate percentage of cells. Blood analysis was performed 4 weeks after transplantation. (b) Quantification of contribution of control or Evi2b-silenced LKS cells to hematopoietic system of the recipient animals 4 weeks after transplantation. The y axis indicates the percentage of GFP+ cells out of CD45.2+ gate. Each group contains at least 10 animals. (c) Number of GFP+ granulocytes derived from the donor (CD45.2+) cells. The Y axis indicates the number of GFP+Gr/Mac1+ × 103 granulocytes per 100.000 Ly5.2+ cells. Each group contains at least five animals. The values on y axes of (b) and (c) were normalized to the original percentage of GFP+ cells measured 2 days after infection. Transplantation experiments were performed three times. (d) Representative contour plots of cell cycle analysis on murine LKS cells transduced with controls NSC1 and NSC2 or Evi2b-downregulating shRNAs Sh3 and Sh4. The x axis indicates Hoechst 33342 staining and the y axis shows Pyronin Y staining. The x and y axes are displayed in linear scale. Numbers indicate the percentage of cells in G0 (lower left quadrant), G1 (upper left quadrant), and G2/S/M phase (upper right quadrant). Right panel indicates quantification of cell cycle analysis in LKS cells transduced with the distinct shRNAs. Black bars indicate percentage of cells in G0, gray bars indicate percentage of cells in G1, and white bars the percentage of cells in G2/S/M. Results are average of three independent experiments

