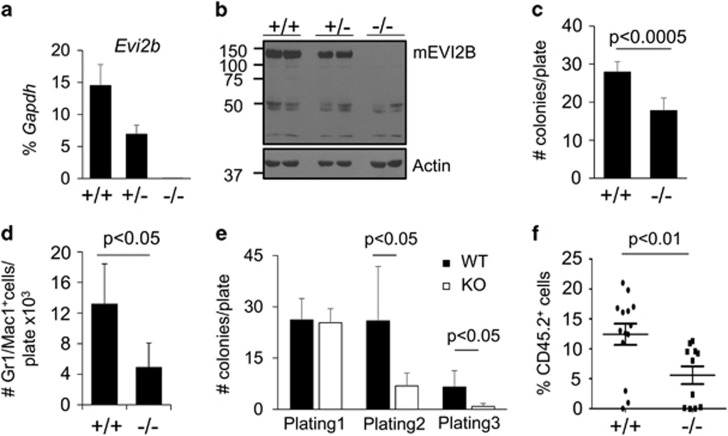
Figure 7.
Bone marrow cells from Evi2b KO mice present impaired repopulating ability in vivo and impaired plating capacities in vitro. (a) Quantitative RT-PCR in Evi2b WT (+/+), heterozygous (+/−) and KO (−/−) BM nucleated cells. The y axis represents relative Evi2b expression compared to Gapdh control. Each group contains 3 mice. (b) EVI2B expression in EVI2B WT, heterozygous and KO mice assessed on protein level using Western blotting. Equal amounts of cells (0.5 × 10⁶cells) were loaded per lane. Antibodies against murine EVI2B were used to evaluate EVI2B expression in Evi2b KO, heterozygous and WT mice (upper panel). Equal loading was verified by staining the membrane with antibody against Actin (lower panel). Positions of m.w. standards (kDa) are shown on the left. (c) Quantification of colonies formed by 10 000 whole BM cells from WT and Evi2b KO mice plated in semisolid medium M3231 supplemented with G-CSF (100 ng/ml). The y axis represents the number of colonies per plate. Counting was performed 10 days after plating. Results represent the average of 6 animals. (d) Quantification of Gr1/Mac1+ cells in cultures from (c). The y axis represents the number of Gr1/Mac1+ cells per plate × 103. (e) Re-plating assays of WT (black bars) and Evi2b KO (white bars) BM cells using Methocult M3434. Initially 5000 BM nucleated cells were plated per well and 2000 cells were re-plated. Colonies were quantified under microscope and re-plated after 10–14 days in semisolid medium. The y axis indicates the number of colonies per plate. This is a representative experiment out of 2. Results indicate the average of 3 independent cultures. (f) Flow cytometric analysis of blood of lethally irradiated recipient mice transplanted with 100.000 WT or Evi2b KO BM nucleated cells along with 0.5 × 10⁶ BM cells. The y axis indicates the percentage of donor (CD45.2+) cells in the blood of recipients 4 weeks after transplantation. Each group contains at least 11 animals. Results include data from three independent experiments

