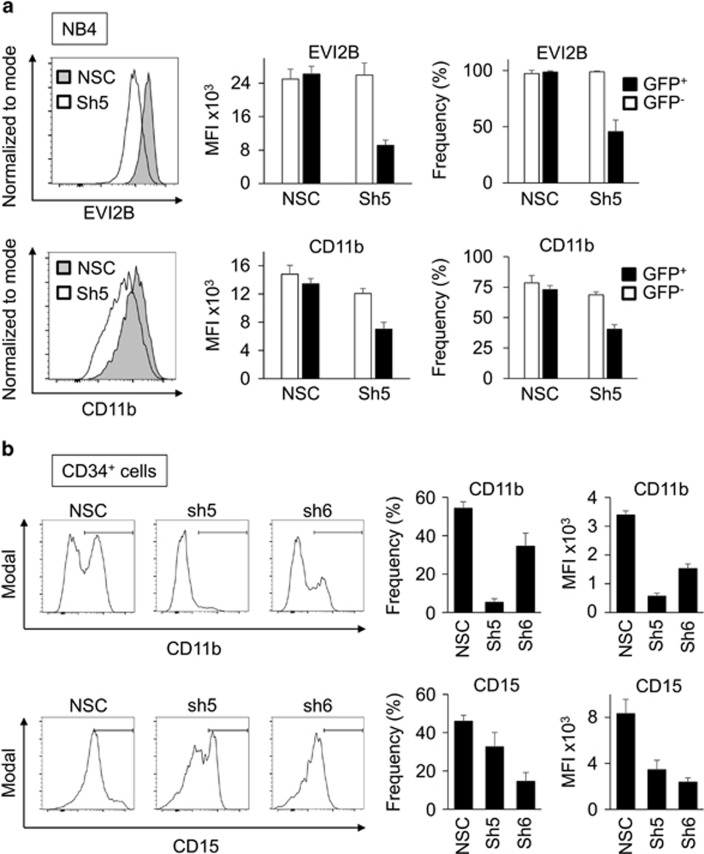
Figure 8.
EVI2B silencing blocks granulocytic differentiation in human cell lines and primary HSPC. (a) Representative histogram plots showing EVI2B (upper) and CD11b (lower) levels in NB4 cells transduced with NSC or EVI2B silencing shRNA (Sh5). The y axes indicate cell counts normalized to mode. Right panels indicate mean fluorescence intensity (MFI) and frequency of positive cells in the infected GFP+ and the control GFP− populations. (b) Representative histogram plots showing CD11b and CD15 staining in human CD34+ cells infected with NSC or EVI2B silencing shRNA (Sh5 and Sh6) upon 10 days in culture. The y axes are shown in modal display mode. Right panels show MFI and frequency of positive cells for CD11b and CD15

