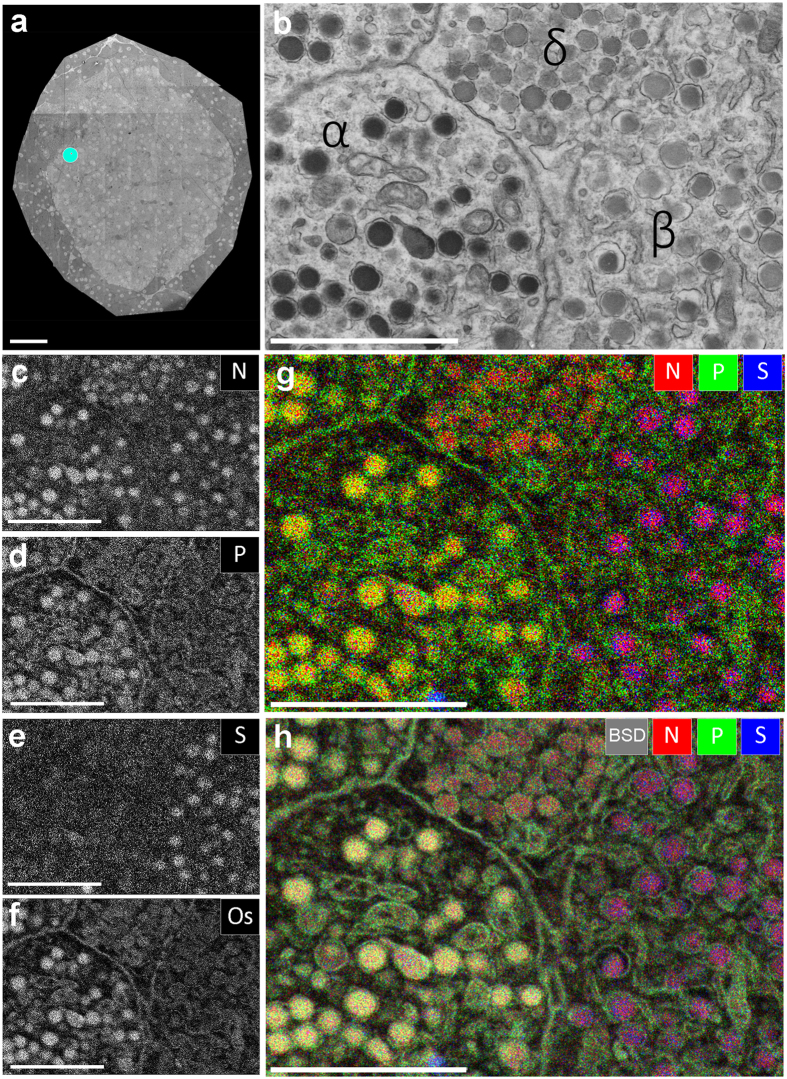
Figure 1. EDX defines cell-types and subcellular structures and organelles in EM images.
(a) 100 nm thin cross-section of an entire rat islet of Langerhans imaged at 2.5 nm pixel size (STEM). Full high-resolution data is available via nanotomy.org (see suppl. material). (b) Area of interest (indicated in a; cyan dot) shows parts of four cells with different granules based on grey levels and morphology. (c–f) Elemental content in the ROI as indicated. (g) Overlay of N (red), P (green) and S (blue) allows identification of cells and granules based on elemental content. (h) Overlay of back scatter ICD image (greyscale) over the color-image of g. Bars: 50 μm (a) and 2 μm (b–h). Maps of other elementals are available as Fig.S1.

