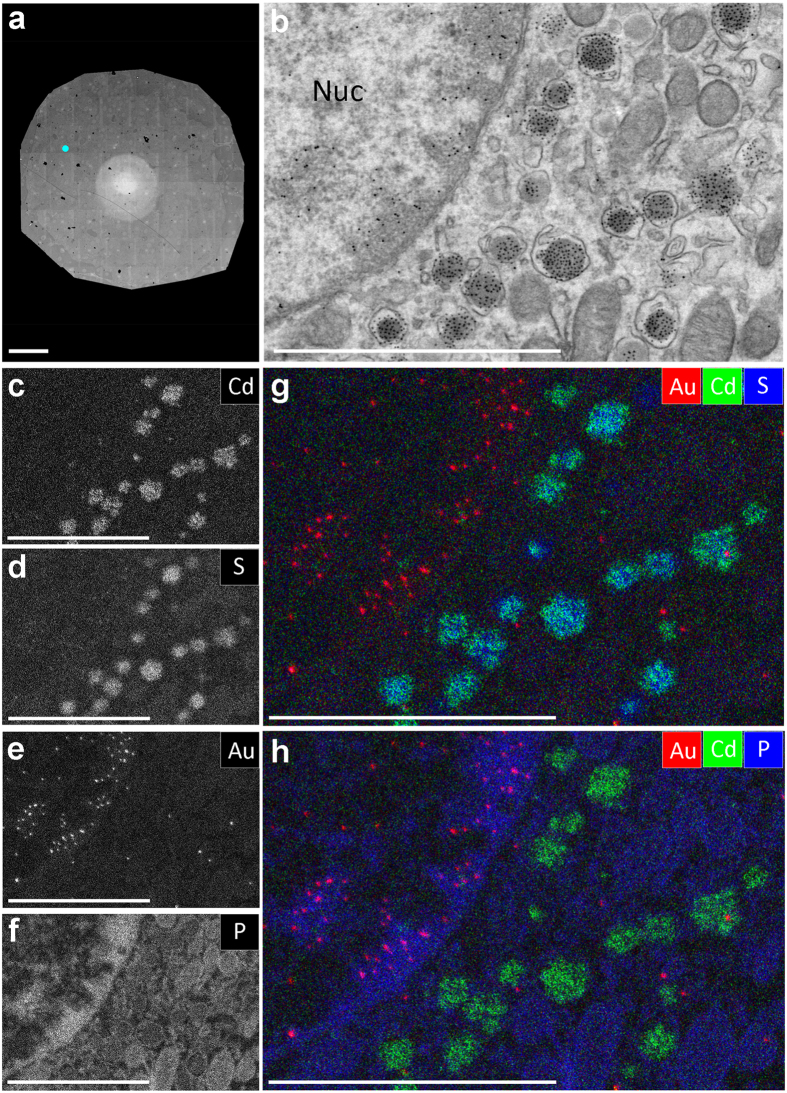
Figure 2. Immuno-based identification of peptides and G4-DNA structures and endogenous elements.
(a) Section of an islet immuno-labeled for G4 (10 nm immunogold) and insulin (QD655). The white area in the middle is an electron-beam pre-exposure artefact, but not hampering data analysis. Full resolution is available via nanotomy.org. (b) Zooming into the data reveals gold particles in the nucleus (upper left part) and quantum dots in insulin granules. Labels are identified based on grey levels and morphology. (c–f) Elemental content in the ROI as indicated. (g,h) Overlay of Au (red), Cd (green) and S (blue; g) or P (blue; h) allows identification of G4 structures based on gold presence and insulin granules based on Cd content. Note the localization of Cd on S-enriched insulin granules (g) and localization of Au to heterochromatin regions enriched in P in the nucleus (h). Bars: 50 μm (a) and 2 μm (b–h). See for more elements Fig. S2 and spectral analysis Fig. S6.

