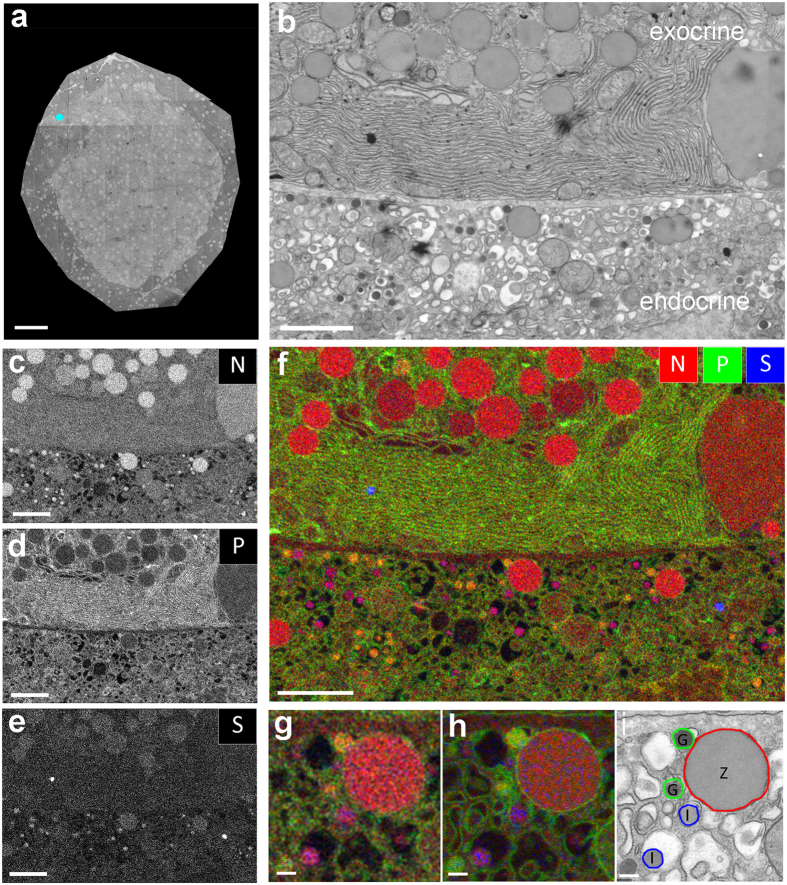
Figure 3. EDX analysis reveals single cells that contain exocrine zymogen granules with endocrine glucagon and insulin.
(a) Overview as in Fig. 1a. (b) Area indicated in (a) by the cyan dot with parts of two cells with different granules based on grey levels and morphology. (c–e) Elemental maps as indicated. (f) Overlay of N (red), P (green) and S (blue) allows identification of cells and granules. (g) Zoom of the center part of f, note the small purple and yellow granules, as well as the big red granule, all present in the same cell. (h) Same region, with P and S combined with the backscatter image, which was reverted to red. Note the membranes around the vesicles. (i) Interpretation of the EDX data on the large scale STEM image showing the presence of three distinct granules in an endocrine cell. Bars: 50 μm (a), 2 μm (b–f) and 0.2 μm (g–i). See for more elements Fig.S3.

