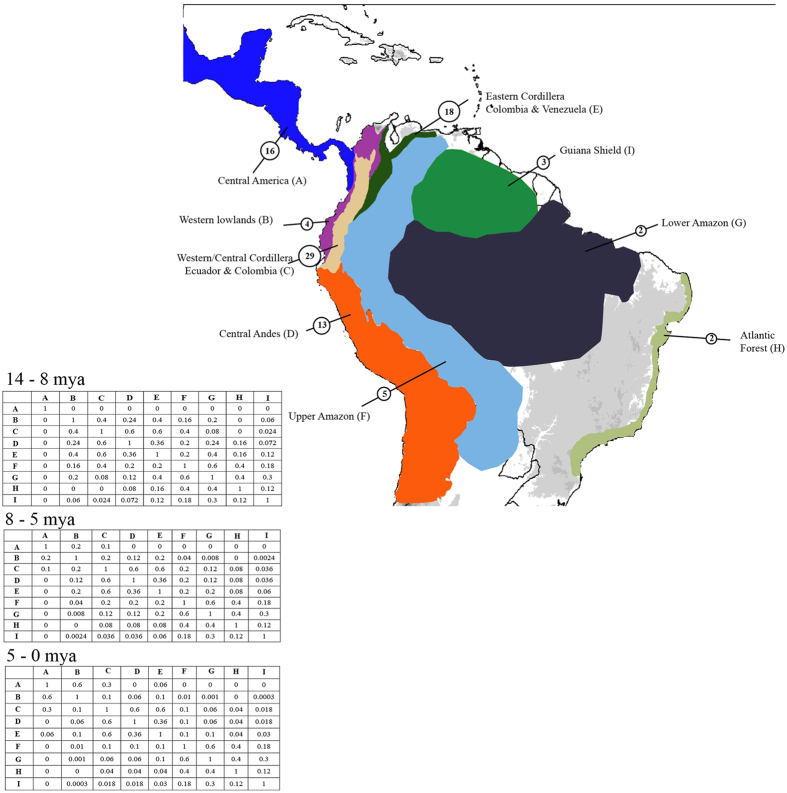
Figure 2. Biogeographical regions used in the DEC and SDEC models for reconstruction of ancestral areas and the dispersal probability matrices for the different time slices.
Species richness in each areas are shown in the circles. The map was generated using ArcGIS 9.3 (http://www.edit.com/software/arcgis/), and edited with Adobe Illustrator 4 (http://www.adobe.com/uk/products/illustrator.html).

