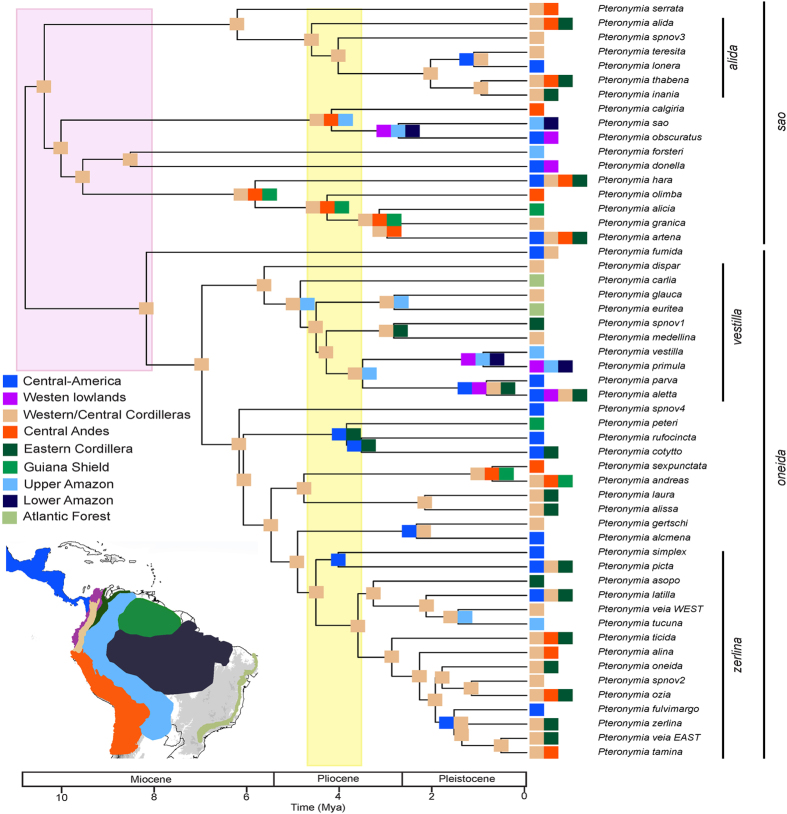
Figure 3. RASP historical biogeography inference (best maximum likelihood estimates on the MCC tree).
Major paleoenvironmental events are indicated by large coloured rectangles (light pink: drainage of the Pebas system; light yellow: hypothesized closure of the Isthmus of Panama). Colours of the little squares at the node and tips of the tree correspond to colours of the biogeographical areas, as indicated in the map inserted (taken from Fig. 2). The figure was generated with R (https://cran.r-project.org/) and edited with Adobe Illustrator 4 (http://www.adobe.com/uk/products/illustrator.html).

