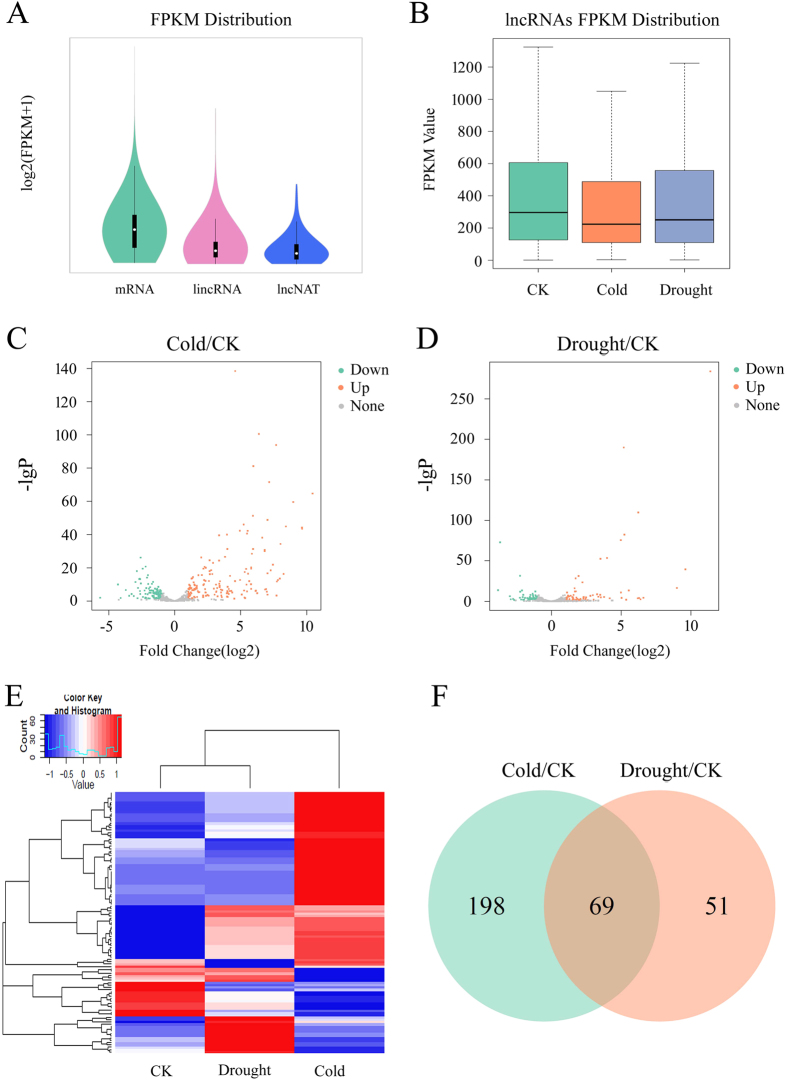
Figure 3. Variation in lncRNA expression under cold or drought stress.
(A) The violin plot of expression levels of mRNAs, lincRNAs and lncNATs. FPKM, fragments per kilobase of exons per million fragments mapped. (B) The box plot of expression levels of lncRNAs under control, cold and drought stress. (C,D) The Volcano plot of differential expressed (D,E) lncRNAs between cold stress and control (C), drought stress and control conditions (D), respectively. (E) Hierarchical clustering of the maximal JS (Jensen-Shannon) specificity score of lncRNA under cold or drought stress. (F) Venn diagram of DE-lncRNAs under cold and/or drought stress.

