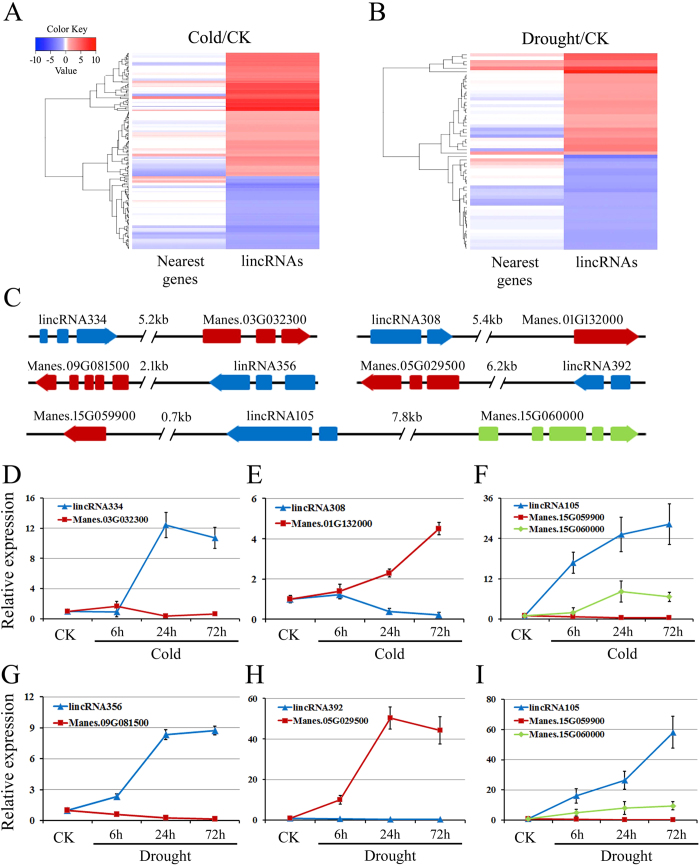
Figure 7. Comparison of the expression pattern of lincRNAs and adjacent protein-coding genes.
(A,B) A heatmap was generated from the fold change values in the RNA-seq data, and was used to visualize the lincRNA and neighbors expression pattern under cold (A) and drought stress (B), respectively. (C) Gene structures of five lincRNAs and nearby protein-coding genes. (D–I) Expression patterns analysis of lincRNA334 (D), lincRNA308 (E), lincRNA356 (G), lincRNA392 (H), lincRNA105 (F,I) and nearby protein-coding genes by qRT-PCR under cold or drought stress, respectively. Data are presented as means ± SD of three independent replicates. MeACTIN was used as the reference gene.

