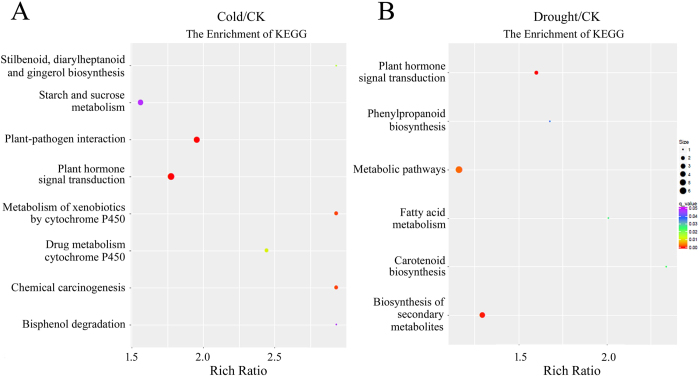
Figure 8. Statistics of KEGG pathway enrichment.
(A,B) KEGG pathway classification of DE-lncRNA-correlated differentially expressed genes under cold (A) and drought stress (B), respectively. The y-axis corresponds to KEGG pathway with a q-value ≤ 0.05, and the x-axis shows the enrichment ratio between the number of DEGs and all unigenes enriched in a particular pathway. The color of the dot represents q value, and the size of the dot represents the number of DEGs mapped to the reference pathways.

