Fig. 2.

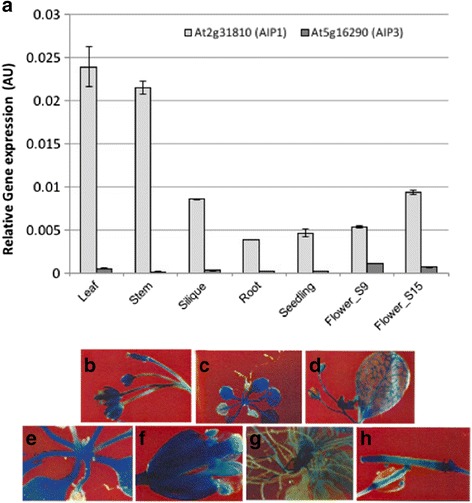
AIP1 and AIP3 have divergent expression patterns. a RNA from the indicated organs was isolated and used to assess AIP1 and AIP3 transcript levels as described in the methods. Organs examined were 4–5-day-old seedlings, stage 5 leaves, green stem, green siliques, stage 9 flowers, and stage 15 flowers. Relative gene expression profiles ± SE after ACTIN2 normalization are depicted. Data presented is representative of two independent biological replicas each with three samples repetitions ± SE. b-h GUS representative expression profiles for AIP1 (750 bp of 5′ putative promoter) promoter-driven GUS transgenic lines
