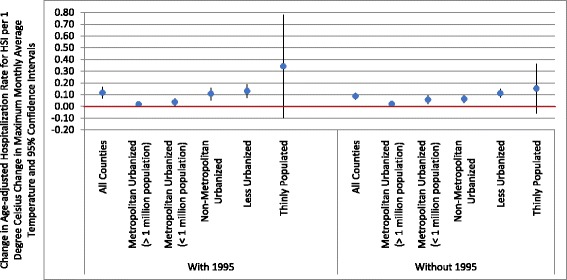
Fig. 3.

Estimated change in heat-stress illness per 1 °C change in maximum monthly average temperature (after adjustment for county percent below poverty level, percent population Black, and percent population Hispanic) and 95% confidence intervals for all counties and by rural/urban stratification (RUCC1–metropolitan urbanized (> 1 million population); RUCC2–metropolitan urbanized (< 1 million population); RUCC3–non-metropolitan urbanized; RUCC 4–less urbanized; RUCC5–thinly populated) for all study years, 1987–2014, and excluding 1995, the year of the heatwave
