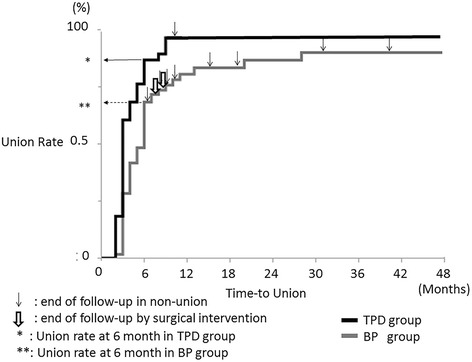
Fig. 2.

Kaplan-Meier curves for time-to-union in the TPD group versus the BP group. The Kaplan-Meier curve showed the time course of union in the TPD group and the BP group (p < 0.001, log-rank test). The thin black arrow shows the end of follow-up with non-union, and the bold white arrow indicates the end of follow-up due to surgical intervention. The union rate was 89% in the TPD group and 68% in the BP group by six months after treatment (p = 0.026, Fisher’s exact test). At the final follow-up, 97% of those in the TPD group and 90% of those in the BP group achieved a stable union (p = 0.243, Fisher’s exact test)
