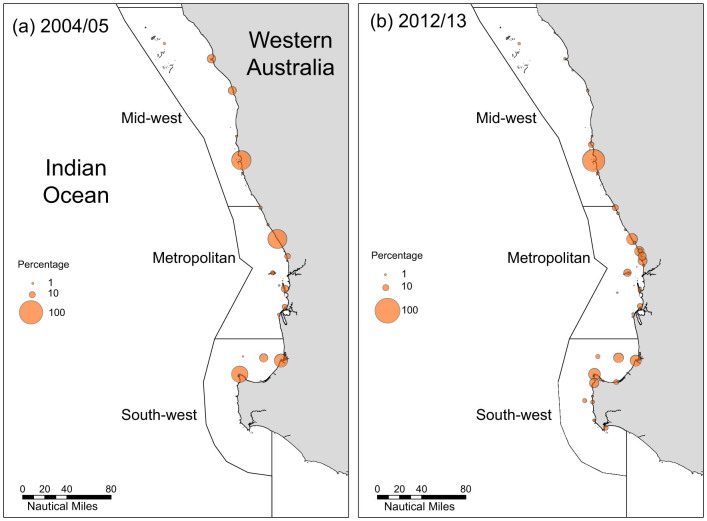
Figure 4. Change over time in the spatial coverage of West Australian dhufish skeleton samples.
General locations of sample origins of West Australian dhufish in each management area during (a) 2004/05 and (b) 2012/13. In each management area (Mid-west, Metropolitan, South-west), orange circles (○) represent the percentage of skeleton samples from each location for that area. Circle size is proportional to percentage. Map created by B.M.C. in ArcGIS ArcMap v. 10.

