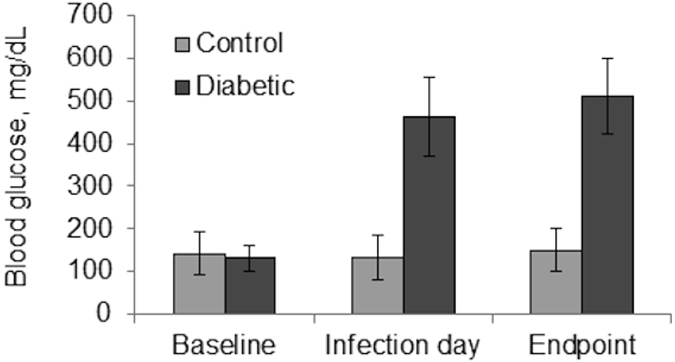
Figure 1. Blood glucoses of both diabetic and control rabbits were measured using a glucose meter.

Values were averaged and analyzed; baseline, p = 0.501; infection day and endpoint, p < 0.001. Error bars represent standard deviation.

Values were averaged and analyzed; baseline, p = 0.501; infection day and endpoint, p < 0.001. Error bars represent standard deviation.