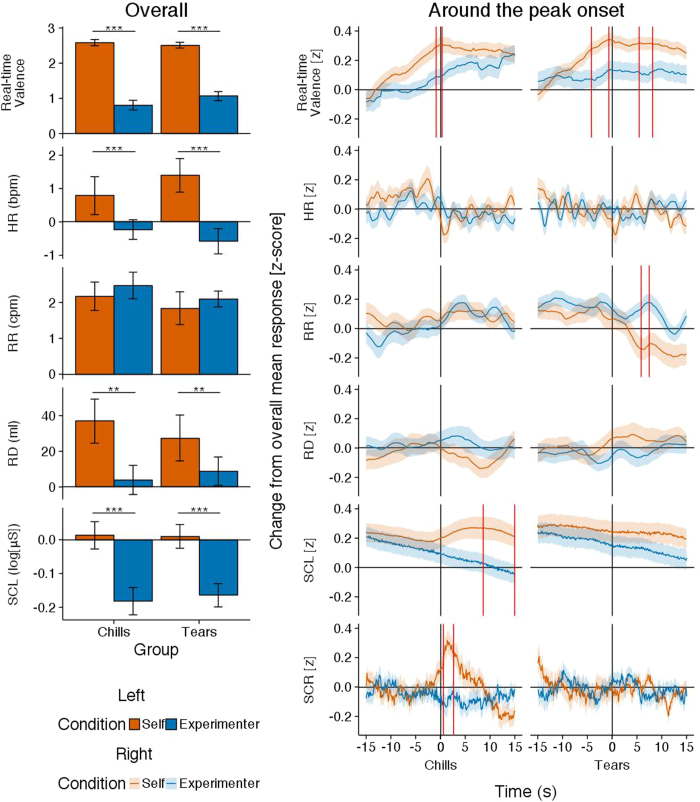
Figure 1. Mean real-time valence ratings and physiological measures for self-selected songs and experimenter-selected songs for the chills and tears peak emotion groups.
The left-hand figure shows the overall mean responses. Error bars represent standard error of the mean. The right-hand figure shows the 30 s around the peak onset responses. Lines indicate the mean with the corresponding standard error of the mean. Regions surrounded by the vertical red lines indicate significant differences zones (p < 0.05). Note. Self = self-selected song, Experimenter = experimenter-selected song, HR = heart rate, RR = respiration rate, RD = respiration depth, SCL = skin conductance level, SCR = skin conductance response.

